
2025-120 East Bay Transit Agencies
They Collaborate Consistently but Face Declining Reserves, Slow Ridership Recovery, and Barriers to Consolidation
Published: May 28, 2026Report Number: 2025-120
May 28, 2026
2025‑120
The Governor of California
President pro Tempore of the Senate
Speaker of the Assembly
State Capitol
Sacramento, California 95814
Dear Governor and Legislative Leaders:
As directed by the Joint Legislative Audit Committee, my office conducted an audit of six East Bay transit agencies providing bus service in Alameda and Contra Costa counties and the Metropolitan Transportation Commission (MTC). Our assessment focused on the agencies’ coordination with each other, their financial conditions, and the potential benefits and challenges of combining these transit agencies. The following report details the audit’s findings and conclusions. In general, we determined that the agencies are coordinating with each other and that transferring between transit systems is generally straightforward and accessible; however, the East Bay transit agencies are at risk of having to reduce service in the near future because of structural budget deficits, and combining these agencies is alone unlikely to solve these financial difficulties.
We found that the transit agencies regularly coordinate, including directly with each other and as part of regional initiatives, and there are few barriers to their collaboration. To arrive at this conclusion, we rode 25 percent of East Bay transit agencies’ bus routes that cross service areas, and we did not identify significant obstacles for transit riders, such as difficulty transferring between the agencies. However, MTC has taken longer than it initially projected to complete many of its regional initiatives to improve the transit rider experience in the Bay Area. In fact, my office reviewed nine of these initiatives, and MTC has not completed any of them within its preliminary time frames.
We also determined that five of the six selected transit agencies may exhaust their reserves within the next one to five years and may need to reduce service if they do not secure additional funding. The East Bay transit agencies also anticipate challenges in meeting the State’s requirements to purchase zero-emission buses because of the vehicles’ high cost.
My office attempted to identify benefits of combining the selected transit agencies but found that various combinations did not resolve the financial challenges of the individual agencies, in part because the combined entities would still have negative unrestricted net positions. Various legal impediments would also complicate such combinations, including federal protections for private contractors. Finally, we determined that standardizing wages and benefits after combining agencies could increase overall labor costs because AC Transit has significantly higher labor costs than the other agencies.
Respectfully submitted,
GRANT PARKS
California State Auditor
Selected Abbreviations Used in This Report
| AC Transit | Alameda-Contra Costa Transit District |
| ARPA | American Rescue Plan Act |
| BART | Bay Area Rapid Transit |
| CARB | California Air Resources Board |
| CARES | Coronavirus Aid, Relief and Economic Security Act |
| County Connection | Central Contra Costa Transit Authority |
| FTA | Federal Transit Administration |
| JPA | Joint powers agencies |
| LAVTA | Livermore Amador Valley Transit Authority |
| MTC | Metropolitan Transportation Commission |
| OPEB | Other postemployment benefits |
| STA | State Transit Assistance |
| TDA | Transportation Development Act |
| Tri Delta Transit | Eastern Contra Costa Transit Authority |
| WestCAT | Western Contra Costa Transit Authority |
Summary of Key Findings and Recommendations
Our audit reviewed six bus service agencies in the San Francisco Bay Area’s East Bay (East Bay transit agencies). These agencies were Alameda-Contra Costa Transit District (AC Transit), Central Contra Costa Transit Authority (County Connection), Livermore Amador Valley Transit Authority (LAVTA, also commonly known as Wheels), Eastern Contra Costa Transit Authority (Tri Delta Transit), Union City Transit, and Western Contra Costa Transit Authority (WestCAT). Our audit also included the Metropolitan Transportation Commission (MTC), which is responsible for regional transportation planning throughout the San Francisco Bay Area. During our review of these transit agencies and MTC, we identified the following key findings:
- The East Bay transit agencies have implemented several initiatives to encourage ridership, but ridership levels for most agencies have only recovered between 59 and 83 percent of their pre-pandemic ridership as of fiscal year 2024–25. As an example of such initiatives, some agencies implemented free ride programs for youth aged 18 and under or made some routes that serve low-income communities free. Most East Bay transit agencies have recently surveyed their riders and those who do not use their services to understand how the agencies can better serve their communities and attract additional riders. The responses to those surveys indicate that riders want more frequent service and greater route coverage. The slow post-pandemic transit ridership recovery we identified is consistent with trends elsewhere in the Bay Area, California, and nationally.
- The East Bay transit agencies regularly coordinate with one another as needed when adjusting routes or schedules and when working on regional initiatives. We found only one minor barrier to their collaboration in the form of agencies using different bus stop identification numbers for the same bus stop, which at times can complicate schedule coordination. The governing documents for the East Bay transit agencies do not constrain their autonomy to plan routes or invest in projects, but state law and MTC regulations do provide some restrictions. For example, as a condition of receiving certain funds, MTC requires transit agencies to participate in various regional initiatives to improve the rider experience, such as fare coordination working groups and mapping and wayfinding projects. Moreover, we determined that MTC has actively facilitated coordination and collaboration with transit agencies in the region, but we identified that it could improve its effectiveness in implementing timely actions. For example, MTC is working to implement a Transit Transformation Action Plan to improve the rider experience through reduced fares and improved signage using new regional standards. However, MTC has taken longer to implement this plan than initially projected and has not updated the public with revised implementation timelines.
- To test the ease or difficulty riders may experience when riding routes that cross the service areas of multiple transit agencies, we took 12 reasonable trips that daily riders in the applicable service areas might take during commute hours. This selection represents approximately 25 percent of the East Bay transit agencies’ routes that cross into each other’s service areas. We did not identify significant obstacles for transit riders or problems with transferring between agencies. For example, 13 of the 24 bus stops we visited included posted bus schedules, and all 24 displayed customer service phone numbers, website addresses, or QR codes available to link riders to schedule and transfer information. We did find that some agencies could improve the quality of information at some bus stops, such as increasing the readability of some signs. Moreover, we did not identify any redundant or duplicative services among agencies with overlapping service areas.
- Apart from Tri Delta Transit, the selected East Bay transit agencies have adequate financial reserves in the short term; however, all but Union City Transit are at risk of depleting those reserves without new funding—some as soon as fiscal year 2026–27. Rising operating costs and limited fare revenue may force these five agencies to consider service reductions if they cannot secure new funding. We determined that fare increases alone cannot address the deficits that transit agencies project. In contrast, Union City Transit, which is part of the city’s public works department and therefore experiences minimal overhead, appears financially stable and is unlikely to reduce service in the medium or long term because of its limited reliance on reserves. Further, the agencies anticipate challenges meeting a state zero-emission vehicle purchasing requirement because the vehicles can be double the cost of diesel vehicles. They are considering seeking one-year exemptions from the requirement from the California Air Resources Board (CARB), but they have indicated that longer exemptions may be necessary. Finally, although MTC’s roles and responsibilities for coordinating funding for the region vary depending on the funding source, it disbursed a total of more than $1 billion to the selected transit agencies over the past three fiscal years for operating and capital expenses.
- We combined the financial statements of the East Bay transit agencies in Alameda County and those in Contra Costa County to assist in determining the likely financial condition of a single, unified bus agency in each of these two counties. The financial information we aggregated indicates that combining these agencies may not provide significant financial benefits because the underlying agencies themselves have negative financial conditions. Specifically, we found that the transit agencies and the hypothetical county-based agencies have negative unrestricted net positions, an important indicator of financial health that serves as a measure of the financial resources available to the agency. As a result, the combined agencies would have limited resources for future operations or expansion of services. Similarly, a single hypothetical transit agency combining all six transit agencies we reviewed also does not appear more financially advantageous. The decision around merging agencies also involves other highly uncertain factors, such as potential increases in operating costs and how the Legislature might choose to dissolve existing agencies if it were to do so. Specifically, because AC Transit directly employs its union-represented staff and the other agencies contract out most of their operations, the resulting combined agencies would likely have higher labor costs than five of the individual agencies currently pay. Further, we also identified significant legal and practical impediments that could limit the feasibility of combining the existing East Bay transit agencies into two new transit agencies in Alameda and Contra Costa counties. For example, over $30 million in voter-approved funding for AC Transit could disappear if AC Transit were dissolved and split into two separate county transit agencies. Additionally, a split of AC Transit could result in inconvenience and commute delays for certain disadvantaged communities in Contra Costa County, such as El Cerrito and Richmond, who would lose direct bus service to job centers such as Oakland in Alameda County.
To address these findings, we have made recommendations to the Legislature and MTC. We recommend that the Legislature consider amending state law to extend the deadline that agencies currently have to make all new bus purchases zero‑emission buses or allocate new funds to the transit agencies for these purchases. Additionally, we recommend that MTC identify any additional funding sources, such as federal, state, or locally-generated revenue, that could be obtained and directed to transit agencies at risk of reducing services. We further recommend that MTC establish realistic and attainable time frames for each of its transit action plan items by setting major milestones and identifying risks and mitigation strategies for delays caused by interdependent activities.
Agency Comments
MTC agreed to implement our recommendations. Because we did not make recommendations to the East Bay transit agencies, we did not expect a response from them.
Introduction
Background
The six current bus service agencies in the East Bay developed over many decades to serve distinct geographic areas. In 1956, voters approved the establishment of AC Transit, providing public transportation services to many of the western portions of Alameda and Contra Costa counties. Although AC Transit later expanded to other areas in the region, it did not provide comprehensive bus services for the entirety of the two counties. Consequently, in the 1970s and 1980s, new transit agencies formed to provide public transportation services in other areas of the East Bay to meet local needs. The text box provides a brief chronology of when each agency was formed.
Year Founded
1956 – AC Transit
1974 – Union City Transit
1976 – Tri Delta Transit
1977 – WestCAT
1980 – County Connection
1985 – LAVTA
Source: JPA agreements and agency websites.
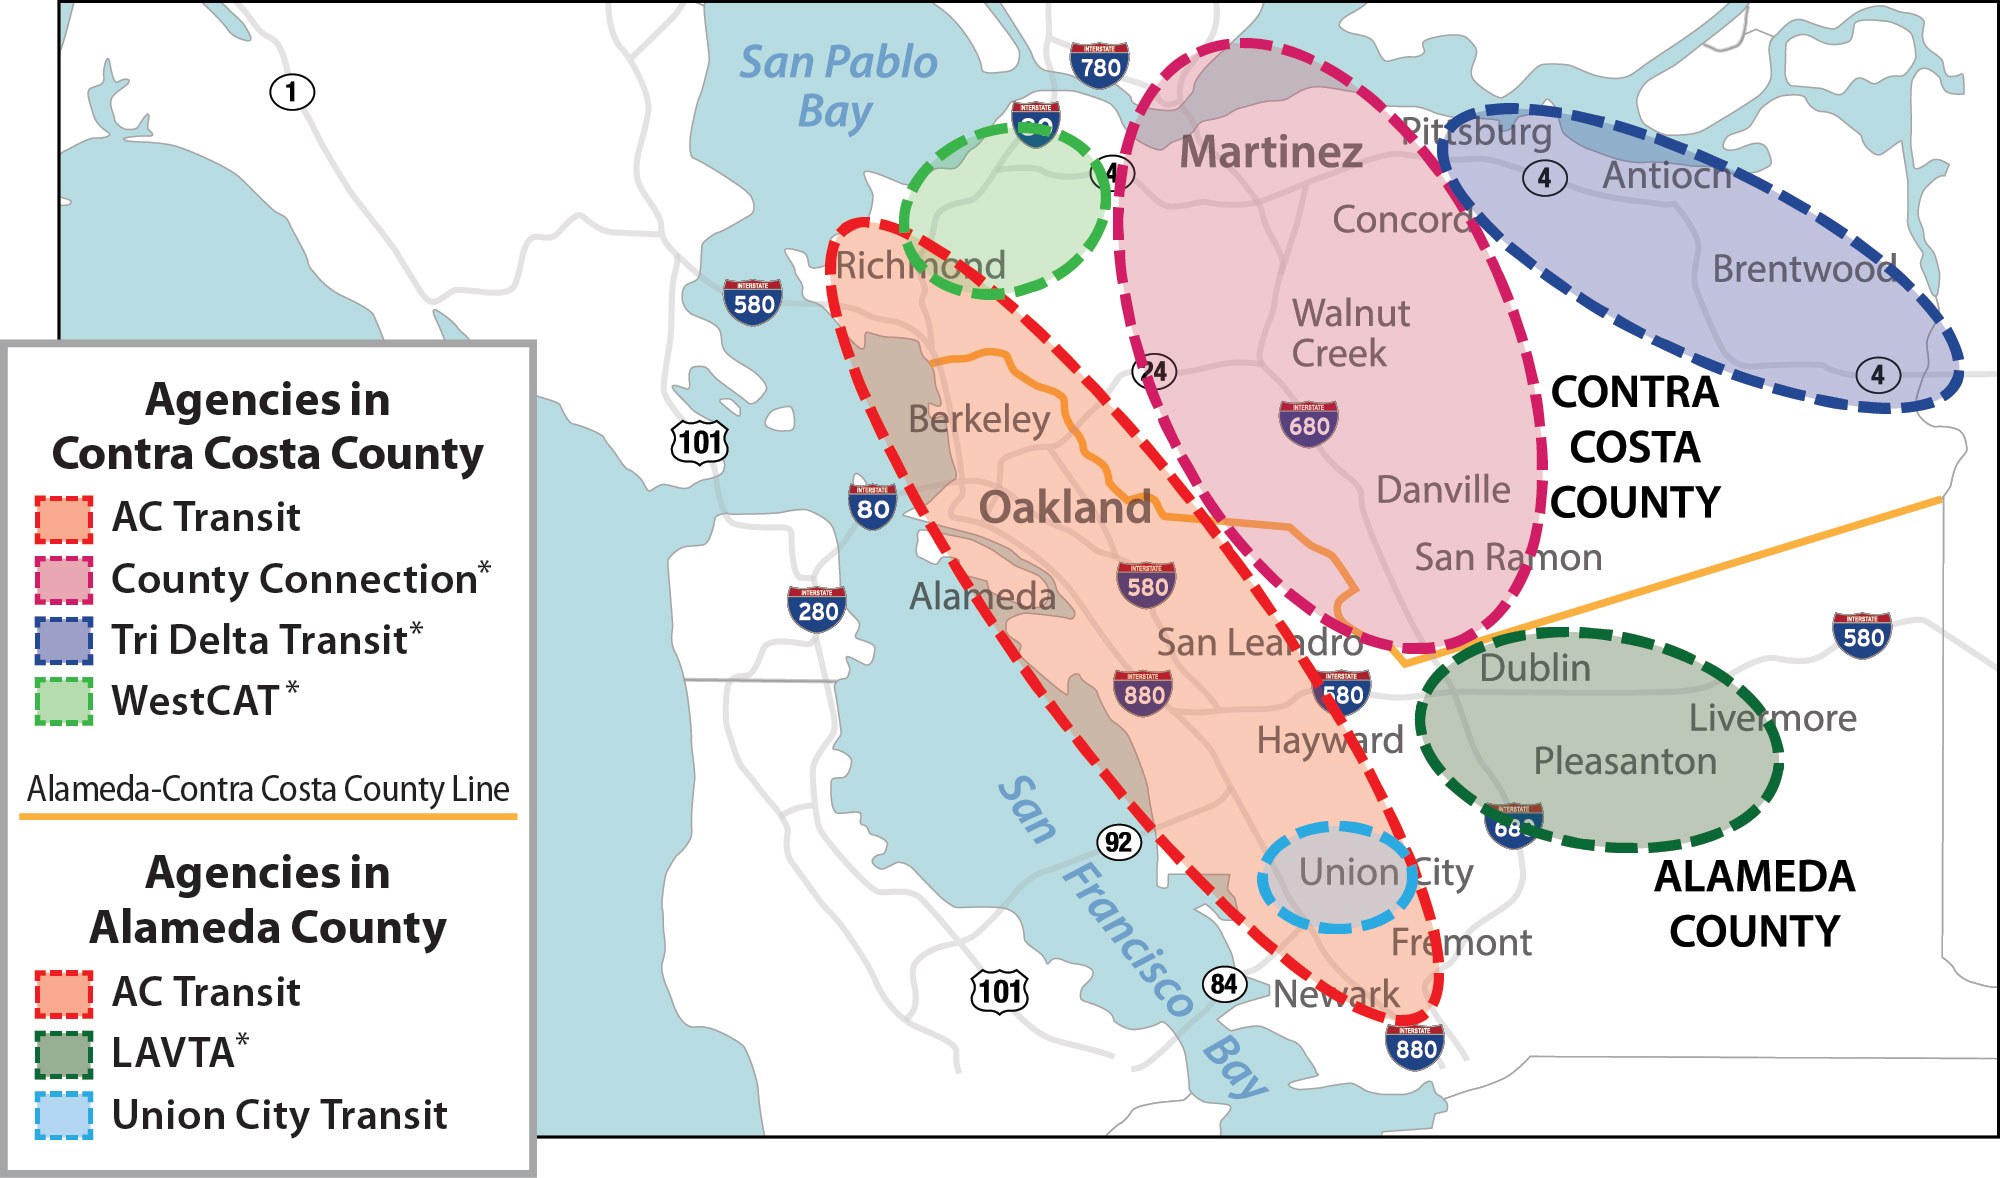
The Legislature directed our office to assess MTC and these six transit agencies, whose approximate service areas we display in Figure 1. Although each of the six transit agencies provide similar bus and transportation services, they differ in the geography they serve and their governing structures. For example, AC Transit is a transit district pursuant to state law governed by an elected board of directors, and Union City Transit is a city-run bus service. The remaining four agencies we reviewed—County Connection, LAVTA, Tri Delta Transit, and WestCAT—are joint powers agencies (JPAs), which are formed by an agreement between public entities—like cities or counties—to jointly exercise any power common to those entities.
Figure 1
East Bay Transit Agencies’ Service Areas
Source: Google Maps and auditor review of agencies’ system maps.
Note: The service area boundaries shown here are rough approximations. Some transit agencies have direct or express routes that connect service areas.
* These agencies are joint powers agencies whose member entities are the cities and counties in the shaded areas.
The approximate service areas of the selected transit agencies in the East Bay region either border each other or in some cases overlap. The agencies in Contra Costa County include AC Transit, County Connection, Tri Delta Transit, and WestCAT. The agencies in Alameda County include AC Transit, LAVTA, and Union City Transit. In the western part of the East Bay, AC Transit and WestCAT overlap partially around the city of Richmond in Contra Costa County, whereas AC Transit and Union City Transit overlap completely in Union City in Alameda County. The service areas of other three agencies in the eastern part of the region—County Connection, LAVTA, and Tri Delta Transit—generally do not overlap with each other or AC Transit, Union City Transit, or WestCAT.
MTC was created in 1971 by state law to provide comprehensive regional transportation planning for the San Francisco Bay Area. It plays a key role in coordinating and overseeing state and federal transit funding for all Bay Area transportation agencies. MTC receives federal funds and then reallocates those funds to transit agencies, and it allocates state funds to transit agencies that are in accordance with MTC’s transit agency coordination plan. From fiscal years 2022–23 through 2024–25, MTC disbursed more than $1 billion to the selected East Bay transit agencies, which represents nearly half of the over $2 billion in revenue that the agencies received during the same period. State law requires MTC to facilitate coordination of fares and schedules between transit agencies in the region, and MTC has the power to apportion or withhold funds from agencies that do not follow specified coordination requirements.
Lawmakers and advocates have cited a variety of concerns about the rider experience and the future of transit in the East Bay, such as difficult and time-consuming transfers across service areas and the financial strain agencies face. For example, some agencies have reduced bus service or are seeking additional funding to maintain their services. Advocates have claimed that the large number of transit agencies in the region is less beneficial to riders than if there were just one agency managing transit throughout the Bay Area. These concerns have led some to consider whether merging transit agencies in the region would produce fiscal benefits and improved rider experiences. The Joint Legislative Audit Committee (Audit Committee) asked our office to assess the transit agencies’ capacity to effectively coordinate with one another, MTC’s oversight, the agencies’ financial conditions, and the projected financial conditions and benefits of combining existing transit agencies in the East Bay into just two agencies, with one serving Alameda County and the other serving Contra Costa County.
Audit Results
Ridership Recovery of Transit Agencies
Key Points
- The East Bay transit agencies have implemented several initiatives to encourage ridership, but as of fiscal year 2024–25, most agencies had not reached their pre‑pandemic ridership levels.
- Most East Bay transit agencies have recently surveyed their riders and nonrider residents in their service areas. Those responses indicate that, although riders are generally satisfied with the agencies’ services, riders and nonriders alike want higher frequency routes. The objectives mentioned below refer to the audit objectives detailed in Appendix C, Table C.
Objective 4:
How Has Ridership Changed Since the Pandemic and How Have Agencies Responded?
Pre- and Post-Pandemic Ridership
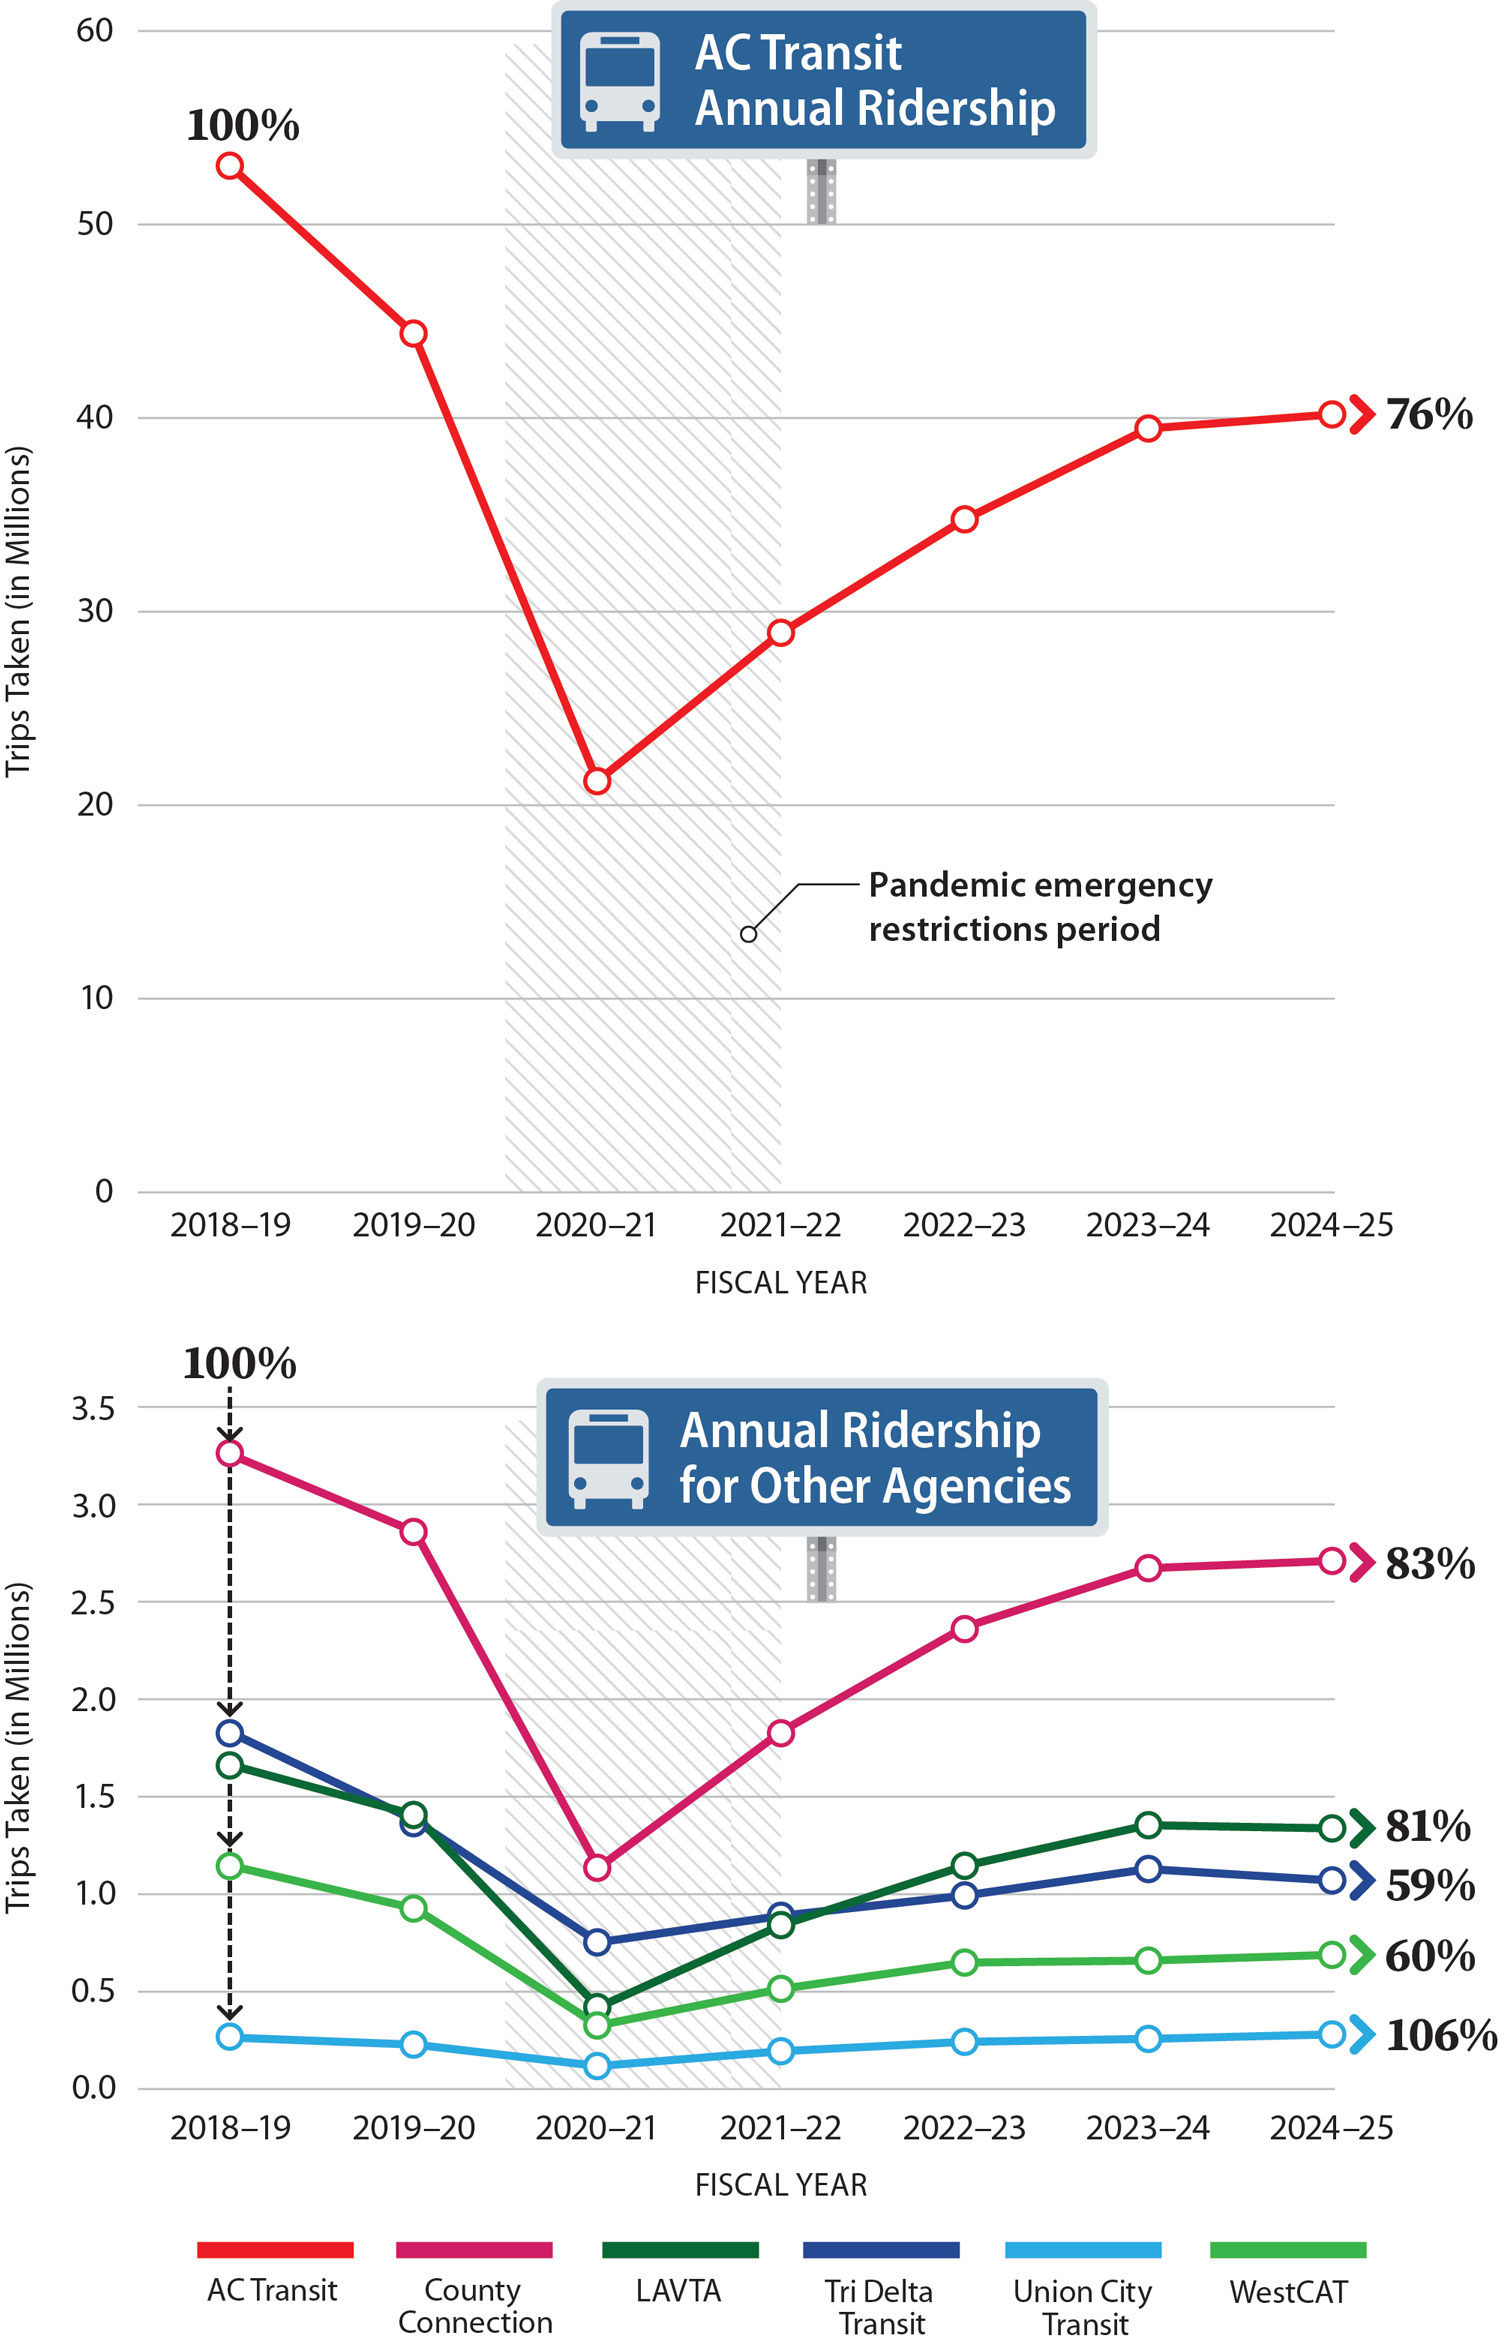
Ridership for the six East Bay transit agencies declined steeply during the pandemic, and, as Figure 2 shows, five of those six agencies have not fully recovered since the pandemic emergency restrictions ended. Only Union City Transit has exceeded its pre-pandemic ridership levels. In contrast, fiscal year 2024–25 ridership for the five other agencies ranged from 59 to 83 percent of their pre-pandemic levels. This decline in ridership compared to the period before the pandemic is not unique to the agencies we reviewed; rather, it is consistent with trends elsewhere in the Bay Area, California, and nationally. For example, in a May 2025 report, MTC estimated that Bay Area transit ridership has recovered to approximately two-thirds of pre‑pandemic levels, and a recent Federal Transit Administration (FTA) report found that nationally total transit ridership was approximately 78 percent of 2019 levels in 2024. We reviewed four studies that investigated why transit ridership has been declining generally. They reported that, in the years prior to the pandemic, transit ridership declined in part because of increases in car ownership and ride hailing apps, such as Uber and Lyft. In more recent years, the prevalence of remote work has further contributed to reduced demand for public transit.
Figure 2
Five of Six Transit Agencies’ Ridership Levels Have Not Yet Recovered From Impacts of the Pandemic
Source: University of California COVID timeline and audit and ridership reports from AC Transit, County Connection, LAVTA, Tri Delta Transit, Union City Transit, and WestCAT.
Note: Ridership is measured in the total boardings across all routes and service days in a given fiscal year. Percentages represent ridership level as share of fiscal year 2018–19 ridership.
Graph 1: AC Transit’s ridership declined from over 50 million annual trips taken in fiscal year 2018-19 to a low of just over 20 million trips taken in fiscal year 2020-21 during the pandemic emergency restrictions period. Since then, AC Transit’s annual ridership increased to about 40 million trips taken in fiscal year 2024-25, representing 76% of its 2018-19 ridership.
Graph 2: This graph shows the ridership of the other five agencies. County Connection’s ridership declined from about 3.3 million annual trips taken in fiscal year 2018-19 to a low of about 1.1 million trips taken in fiscal year 2020-21. Since then, its ridership increased to about 2.6 million trips taken in 2024-25, representing 83% of its 2018-19 ridership. LAVTA’s ridership declined from about 1.6 million annual trips taken in fiscal year 2018-19 to a low of about 420,000 trips taken in fiscal year 2020-21. Since then, its ridership increased to about 1.3 million trips taken in 2024-25, representing 81% of its 2018-19 ridership. Tri Delta Transit’s ridership declined from about 1.8 million annual trips taken in fiscal year 2018-19 to a low of about 750,000 trips taken in fiscal year 2020-21. Since then, its ridership increased to about 1 million trips taken in 2024-25, representing 59% of its 2018-19 ridership. WestCAT’s ridership declined from about 1.1 million annual trips taken in fiscal year 2018-19 to a low of about 320,000 trips taken in fiscal year 2020-21. Since then, its ridership increased to about 680,000 trips taken in 2024-25, representing 60% of its 2018-19 ridership. Union City Transit’s ridership declined from about 260,000 annual trips taken in fiscal year 2018-19 to a low of about 100,000 trips taken in fiscal year 2020-21. Since then, its ridership increased to about 280,000 trips taken in 2024-25, representing 106% of its 2018-19 ridership.
Ridership Initiatives
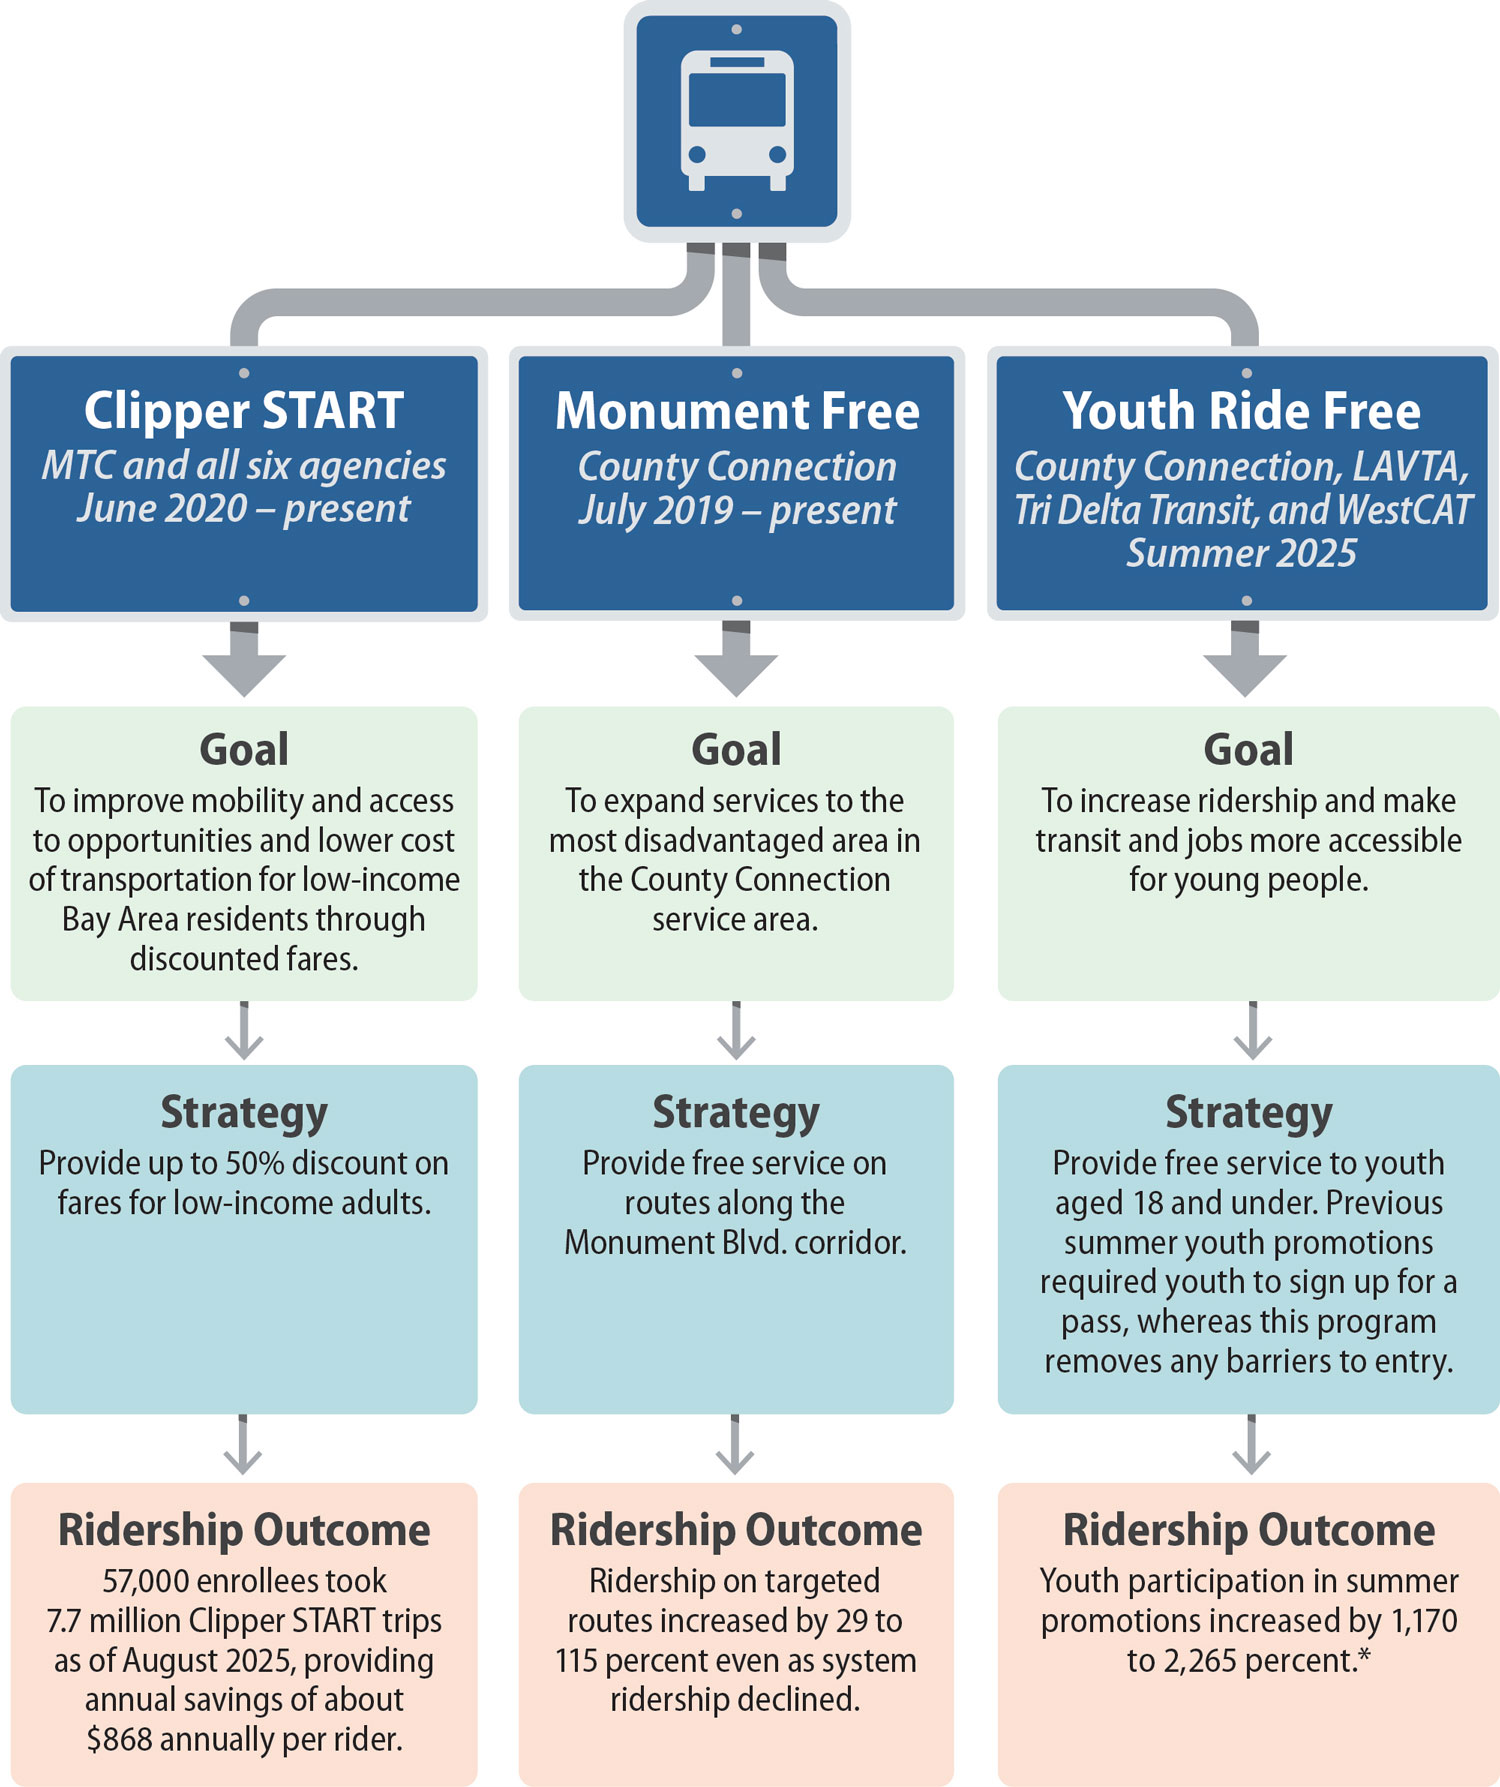
To encourage residents to take public transit, transit agencies sometimes conduct ridership initiatives, free fare promotions, and marketing campaigns to highlight the value of their services. These initiatives have not all necessarily increased ridership but have generally benefited riders, including by providing free fares to specific or general populations. We reviewed a range of ridership initiatives that the transit agencies conducted from 2018 through 2025. We found that they implemented some initiatives in the two years before the pandemic, but most of the initiatives we analyzed occurred after the pandemic. Figure 3 describes a few examples of notable ridership initiatives and their outcomes. The three initiatives displayed in the figure required varying degrees of spending from the agencies themselves, sometimes offset by external funding from MTC or other entities. For example, with funding from the State’s Low Carbon Transit Operations Program, County Connection launched its Monument Free Program, which eliminated fares on three routes that predominantly serve low-income communities. Since the implementation of this initiative in 2019, ridership along these three routes has increased by between 29 and 115 percent, even as systemwide ridership declined by 20 percent. In summer 2025, County Connection, LAVTA, Tri Delta Transit, and WestCAT all participated in the Youth Ride Free summer program, offering free fares for riders age 18 and younger. The program aimed not just to increase transit use for that summer but to encourage lifelong public transit use. All four agencies identified an increase in youth ridership as a result of the program. Because our review of ridership data did not extend past fiscal year 2024–25, we cannot determine the impact of the program on youth ridership at these agencies in the time since the promotion ended.
Figure 3
Ridership Initiatives Have Provided Benefits to Transit Users
Source: Agency documents.
* This range does not include LAVTA because its prior summer youth promotion was not as comparable.
First Example: Clipper START, in which MTC and all six agencies have participated since June 2020.
Goal: To improve mobility and access to opportunities and lower cost of transportation for low-income Bay Area residents through discounted fares.
Strategy: Provide up to 50% discount on fares for low-income adults.
Ridership Outcome: 57,000 enrollees took 7.7 million Clipper START trips as of August 2025, providing annual savings of about $868 per rider.
Second Example: Monument Free, which has been a County Connection initiative since July 2019.
Goal: To expand services to the most disadvantaged area in the County Connection service area.
Provide free service on routes along the Monument Boulevard corridor.
Ridership Outcome: Ridership on targeted routes increased by 29 to 115 percent even as system ridership declined.
Third Example: Youth Ride Free, in which County Connection, LAVTA, Tri Delta Transit, and WestCAT have participated during the summer since 2025.
Goal: To increase ridership and make transit and jobs more accessible for young people.
Strategy: Provide free transit service to youth aged 18 and under.
Ridership Outcome: Youth participation in summer promotions increased by 248 to 1,170 percent.
Although these initiatives may have had limited impacts on specific ridership groups, we could not determine a direct relationship between the initiatives an agency pursued and the overall rate of ridership recovery. For example, we identified seven notable ridership initiatives that Tri Delta Transit pursued, including a partnership campaign with the Transit mobile app, participation in the previously mentioned Youth Ride Free promotion, and major service adjustments following a comprehensive operations analysis. Despite these efforts, Tri Delta Transit’s ridership recovery has not kept pace with most of the other bus transit agencies in the East Bay. In contrast, we identified only three ridership initiatives at Union City Transit, and these initiatives tended to be much smaller in scale, such as the elimination of paper transfers for customers exiting the Union City Bay Area Rapid Transit (BART) station in 2021. Nevertheless, Union City has experienced the strongest ridership recovery of the six agencies under review. Management at Union City Transit attributes the agency’s ridership recovery not to any particular policy choice but to two possible factors, with one being the number of student riders in its service area who use its services. As Table 1 shows, 36 percent of Union City Transit’s riders were students in fiscal year 2024–25. However, LAVTA’s overall ridership recovery was not as complete, despite even higher youth ridership. Union City’s transit manager stated that another contributing factor could be that Union City Transit never reduced its overall service hours by redirecting service during the pandemic and was able to maintain higher frequencies on key routes. In contrast, the transit manager stated that he believed other agencies did reduce service hours and have not been able to restore them to increase their frequencies again, possibly contributing to riders’ reluctance to use or go back to public transit. Union City Transit has also experienced a unique growth in its weekday ridership that has increased at equal pace to its weekend ridership since the pandemic. For all other agencies, weekday ridership growth has lagged behind that of weekend ridership.
Rider Satisfaction Surveys
All six agencies have either recently conducted a customer satisfaction survey to understand how to improve the passenger experience, or currently have a survey underway, as shown in the text box. As Table 2 demonstrates, most survey respondents indicated satisfaction with the respective agency’s services. For example, LAVTA’s 2025 survey, carried out in September and October of that year, found that riders were generally satisfied with the transit agency’s services, and over 70 percent of riders rated timeliness, cleanliness, and the helpfulness of bus drivers as 4 or 5 on a 5-point scale. County Connection’s 2023 survey reported general rider satisfaction with its services, particularly the cleanliness of the buses, driver courtesy, and connections with other transit agencies. In WestCAT’s 2024 survey, a majority of respondents indicated that more frequent service and improved real-time arrival information at major bus stops was important or very important, but like LAVTA and County Connection riders, they also indicated overall satisfaction with WestCAT’s services, particularly the courtesy and helpfulness of drivers. Finally, although Union City Transit had not conducted a customer satisfaction survey in recent years, its manager noted that it began a survey in March 2026 that aims to reach both riders and nonriders. MTC’s recent survey of Union City Transit passengers found that a majority of respondents rated their experience as good or excellent.
Timing of Rider and/or Nonrider Surveys
AC Transit: 2023
County Connection: 2023, 2025
Tri Delta Transit: 2024
WestCAT: 2024, 2025
LAVTA: 2025
Union City Transit: 2026
Source: Agency survey documents.
Four of the six agencies—AC Transit, County Connection, Tri Delta Transit, and WestCAT—have also recently attempted to survey nonriders in their service area to gain a better understanding of what might encourage residents to increase their use of public transit. Some examples of factors that nonriders said would encourage them to use the agencies’ services are listed in the text box. From January to March 2025, WestCAT conducted an online survey of nonriders who live or work in the WestCAT service area. The survey asked what improvements would make them consider using WestCAT. Most respondents indicated that more frequent service and real-time arrival information would make them more likely to use WestCAT’s services. Faster service and service closer to where riders want to go were also popular responses. About 30 percent of respondents indicated that better connections to other transit systems would be an attractive improvement. These current nonrider‑respondents indicated that they would be more likely to use WestCAT if it offered improved coordination or integration with other transit providers, such as BART and AC Transit. The survey noted that these comments reflect a strong desire for WestCAT to function more effectively as part of an integrated regional transit network.
Factors That Nonriders Indicate Would Encourage Them to Use East Bay Transit Services
- More frequent service
- Real-time information
- Services closer to residence
- Shorter wait times and delays
- Increased weekend and evening service
- Faster service
Source: Agency survey documents.
Tri Delta Transit, AC Transit, and County Connection recently conducted surveys that reached both riders and nonriders. As part of the Realign project, which launched a new bus network across its system, AC Transit conducted a survey from April through June 2023 that included both riders and nonriders. The survey found that riders and nonriders alike value high frequency, short wait times, and reliable on-time performance. In June and July 2024, Tri Delta Transit conducted an online community survey that included nonriders and found similar priorities for improving transit to attract them to use its system. Most respondents indicated general satisfaction with existing services, particularly the agency’s communication with riders. However, many also indicated that they would like Tri Delta Transit to offer more frequent service, increased weekend and evening service, better-timed transfers with BART, and more direct service closer to where they want to travel. In October and November 2025, County Connection also conducted an online survey of riders and nonriders. When asked to rank the importance of several potential actions to make riding the bus more appealing, survey respondents indicated that efforts to reduce travel time for passengers by decreasing the amount of time it takes to get from one stop to another and reducing delays were the most important actions. In written responses, many respondents additionally cited more frequent service as a factor that would encourage them to ride transit more often. However, as we discuss in the Objective 8 section of this report, the agencies are generally not in a position to expand service because most may need to cut existing services in the future unless they secure additional funding. Moreover, a 2020 study determined that the Bay Area lost more than five percent of its annual riders in 2017 and 2018 despite service increases. As a result, even if agencies were financially positioned to respond to nonriders’ desire for increased service, doing so would not necessarily lead to increased ridership.
LAVTA confirmed that it plans to complete a market study by October 2026 that will include nonriders and that it has taken steps to hire a contractor to complete this study. Union City stated that the transit planning process it recently started will allow it to obtain this public transit feedback. As of March 2026, Union City Transit has a survey underway to obtain information on rider and nonrider preferences for future service adjustments.
Coordination Among Transit Agencies
Key Points
- The governing documents for the East Bay transit agencies do not constrain their autonomy to plan routes or invest in projects, but state law and MTC rules do provide some coordination requirements. Additionally, the East Bay transit agencies collaborate with each other regularly, and we identified only one example of a barrier to coordination between the agencies.
- We rode 25 percent of East Bay transit agencies’ bus routes that cross service areas, and we did not identify significant obstacles for transit riders transferring between service areas, although agencies could improve the quality of information at some bus stops. We also did not identify any duplicative routes among agencies with overlapping service areas.
- MTC actively coordinated with transit agencies on transit action plan items related to improving the rider experience, although actions took longer to implement than MTC initially projected. We further found that all selected agencies are compliant with regional accountability measures MTC has established that focus on coordination and improving the customer experience.
Objective 2:
Does Transit Agency Autonomy Limit Collaboration?
Transit Agency Policies and Coordination Requirements
Our review of agency policies did not find that they impose limitations on the agencies’ autonomy to plan routes or invest in transit projects. The agencies’ governing documents—including joint powers agreements, board policies, or by-laws—do not impose clear requirements that would restrict their autonomy when planning routes or investing in projects. For example, Tri Delta Transit and WestCAT note in their joint powers agreements that they will cooperate with other agencies to provide a connected regional transit service, but this language is broad and does not establish specific requirements. AC Transit uses similar language in its board policies. Union City Transit has an internal policy that allows it to take advantage of cooperative agreements or joint procurements, but its transit manager noted that this is not a requirement. LAVTA’s bylaws explicitly state that its board will determine when LAVTA will coordinate with other agencies, reinforcing the agency’s autonomy to plan routes and invest in transit projects. Therefore, we determined that the agencies’ governing documents do not impose requirements that limit their autonomy to plan routes or invest in projects.
Legal Requirements to Coordinate With Other Transit Agencies
MTC and state law require coordination between the transit agencies that impose some limits on transit agency autonomy to invest in transit. State law requires MTC to adopt rules and regulations to promote the coordination of fares and schedules for all public transit systems within its jurisdiction and authorizes it to withhold funds from agencies that do not participate in a regional transit coordinating council. According to state law, the regional transit coordinating council is an entity that MTC must have established to better coordinate routes, schedules, fares, and transfers among the San Francisco Bay Area transit agencies. MTC passed a resolution that allows it to withhold, restrict, or reprogram funds and allocations to a transit agency to the extent allowed by statute, rule, regulation, or MTC policy if it determines that the agency has not made reasonable efforts to implement coordination requirements that the text box describes.1 Agencies that do not meet these requirements could lose their funding, which effectively limits their autonomy to invest in some transit projects.
Examples of MTC Coordination Requirements for Transit Agencies
Have a revenue sharing agreement with every connecting agency, which can include free or discounted transfers.
Waive fees for permits they would otherwise charge to MTC, other agencies, or contractors to implement and maintain transit coordination projects.
Provide accurate, complete, and timely route, schedule, and fare data for dissemination to third parties, such as Google Maps.
Source: MTC resolution.
Transit Agency Collaboration
The East Bay transit agencies follow a structured process to implement service changes, including synchronizing schedules across the Bay Area. In recent years, BART reported that many transit agencies across the Bay Area have modified their processes so that they implement schedule changes at the same time twice each year—once in January and again in August. According to BART, the number of agencies that have aligned their schedule changes with BART increased from four to 20 of 27 transit agencies in the Bay Area from 2022 through 2025. BART noted that agencies meet several months in advance of the schedule changes to share planned changes and identify opportunities to improve transfers. BART attributed this improved engagement to Bay Area transit general managers meeting on a weekly basis to make transit more rider-focused and efficient.
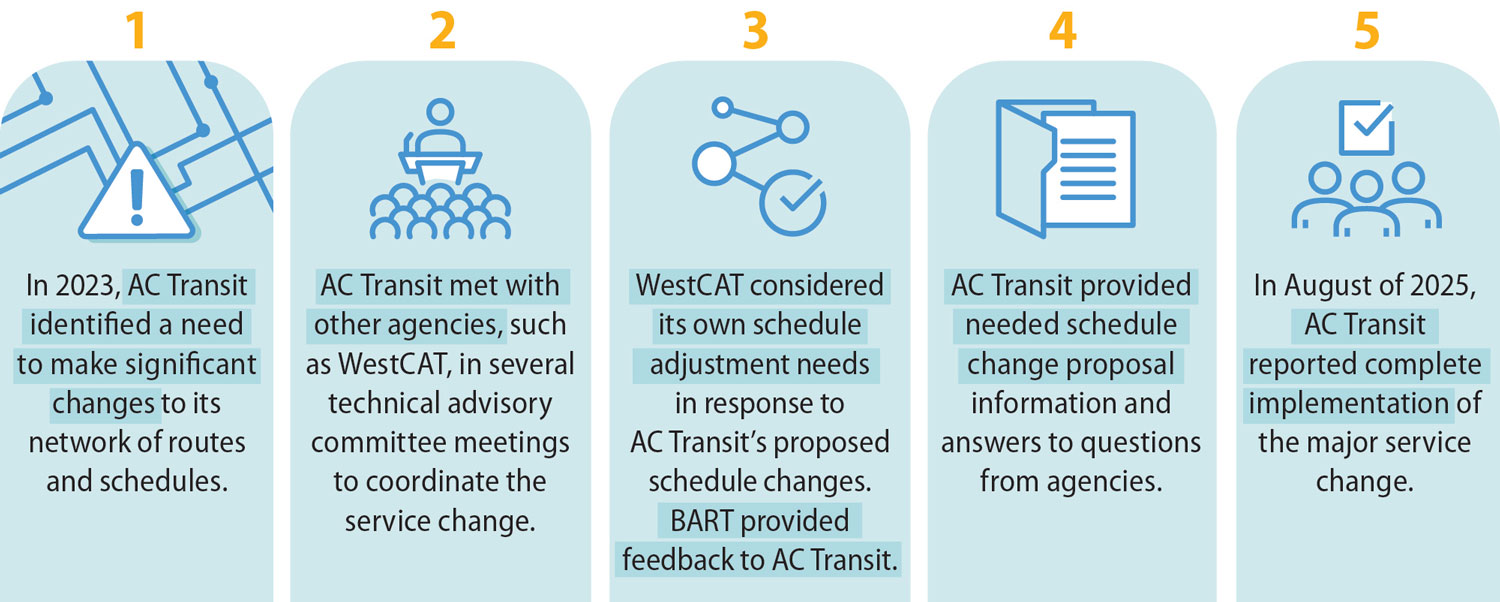
Agencies also coordinate individually as needed when other agencies are considering service changes that may affect their routes or riders. As Figure 4 shows, AC Transit coordinated with WestCAT while planning its own service changes. Specifically, WestCAT asked AC Transit whether it planned to change the frequency of routes serving Contra Costa College, to ensure convenient connections between WestCAT’s and AC Transit’s routes. In response, AC Transit noted that some routes would have 30 minute frequencies while others would only have slight schedule changes. It also provided its proposed schedules to WestCAT, which facilitated planning further schedule changes. In another instance, Union City Transit staff asked a question about changes to route frequencies, to which AC Transit staff provided an answer to facilitate coordination with Union City Transit.
Figure 4
AC Transit Coordinated With Other Agencies During Its Most Recent Service Change
Source: AC Transit meeting minutes, communications with other agencies, and interview confirmation.
In 2023, AC Transit identified a need to make significant changes to its network of routes and schedules.
AC Transit met with other agencies, such as WestCAT, in several technical advisory committee meetings to coordinate the service change.
WestCAT considered its own schedule adjustment needs in response to AC Transit’s proposed schedule changes. BART provided feedback to AC Transit.
AC Transit provided needed schedule change proposal information and answers to questions from agencies.
In August of 2025, AC Transit reported complete implementation of the major service change.
By reviewing related meeting minutes, we determined that the East Bay transit agencies also participate in regular regional meetings to facilitate collaboration. Table 3 shows five examples of regional meetings in which the East Bay transit agencies gather with each other and with other regional agencies to coordinate on transit matters in the Bay Area. For example, AC Transit’s general manager and six other executives from Bay Area transit agencies meet monthly as part of the Regional Network Management Council to focus on customer initiatives. The other five agencies—County Connection, LAVTA, Tri Delta Transit, Union City Transit, and WestCAT—convene weekly as part of Small Operator General Manager meetings to share updates, such as on Regional Network Management activities, and discuss projects aimed at improving the rider experience.
Notwithstanding having identified strong evidence of ongoing communication among transit agencies, we still searched for any barriers that might prevent the East Bay transit agencies from coordinating transit projects or that could affect their daily operations. Coordination can become necessary when an agency plans to adjust a route that interacts with another agency’s network and that agency wants to provide good connections with those networks. We found only one example of a barrier to coordination: Union City Transit’s transit manager noted that agencies have different bus stop identification numbers, which can present challenges when coordinating schedules because if two transit agencies use different numbering systems, one agency’s reference to a bus stop number may cause confusion about which bus stop the agency is actually discussing. However, MTC is currently working on a solution to address this issue through a wayfinding and mapping standards project, which we discuss in relation to Objective 6. Most of the East Bay transit agencies stated that they have not found there to be significant barriers to their collaboration.
Two reasons that few barriers to collaboration exist may be partly because half of the agencies do not have significant overlap of their service areas and because the agencies make a concerted effort to eliminate any barriers. For example, we found that only 15 percent or less of County Connection’s, LAVTA’s, and Tri Delta Transit’s routes require coordination. In contrast, about 33 percent of AC Transit’s routes, 58 percent of WestCAT’s, and all of Union City Transit’s routes require coordination with other agencies. To complete our analysis, we visually identified a selection of routes that cross service areas and routes that share stops with other East Bay transit agencies, both of which indicate a need for coordination. However, as we describe above, we observed effective coordination among these agencies through regional transit agency meetings and other ad-hoc schedule coordination, and we also describe the risk of duplicative services under Objective 3. Regarding efforts to eliminate barriers, Union City Transit’s transit manager stated that before the pandemic, BART would only announce to certain transit agencies, not all transit agencies, when it was making service changes and that it often provided little advance notice. Since the pandemic, BART’s service change announcements have been made earlier and have included more transit agencies, allowing for better alignment of schedules across the region. Additionally, MTC’s Transit Transformation Action Plan (transit action plan) includes various efforts to increase coordination in the region, which we explain in greater detail related to Objective 6.
Objective 3:
Can Riders Easily Navigate Interagency Transit Connections?
Review of Bus Stops and Accessibility
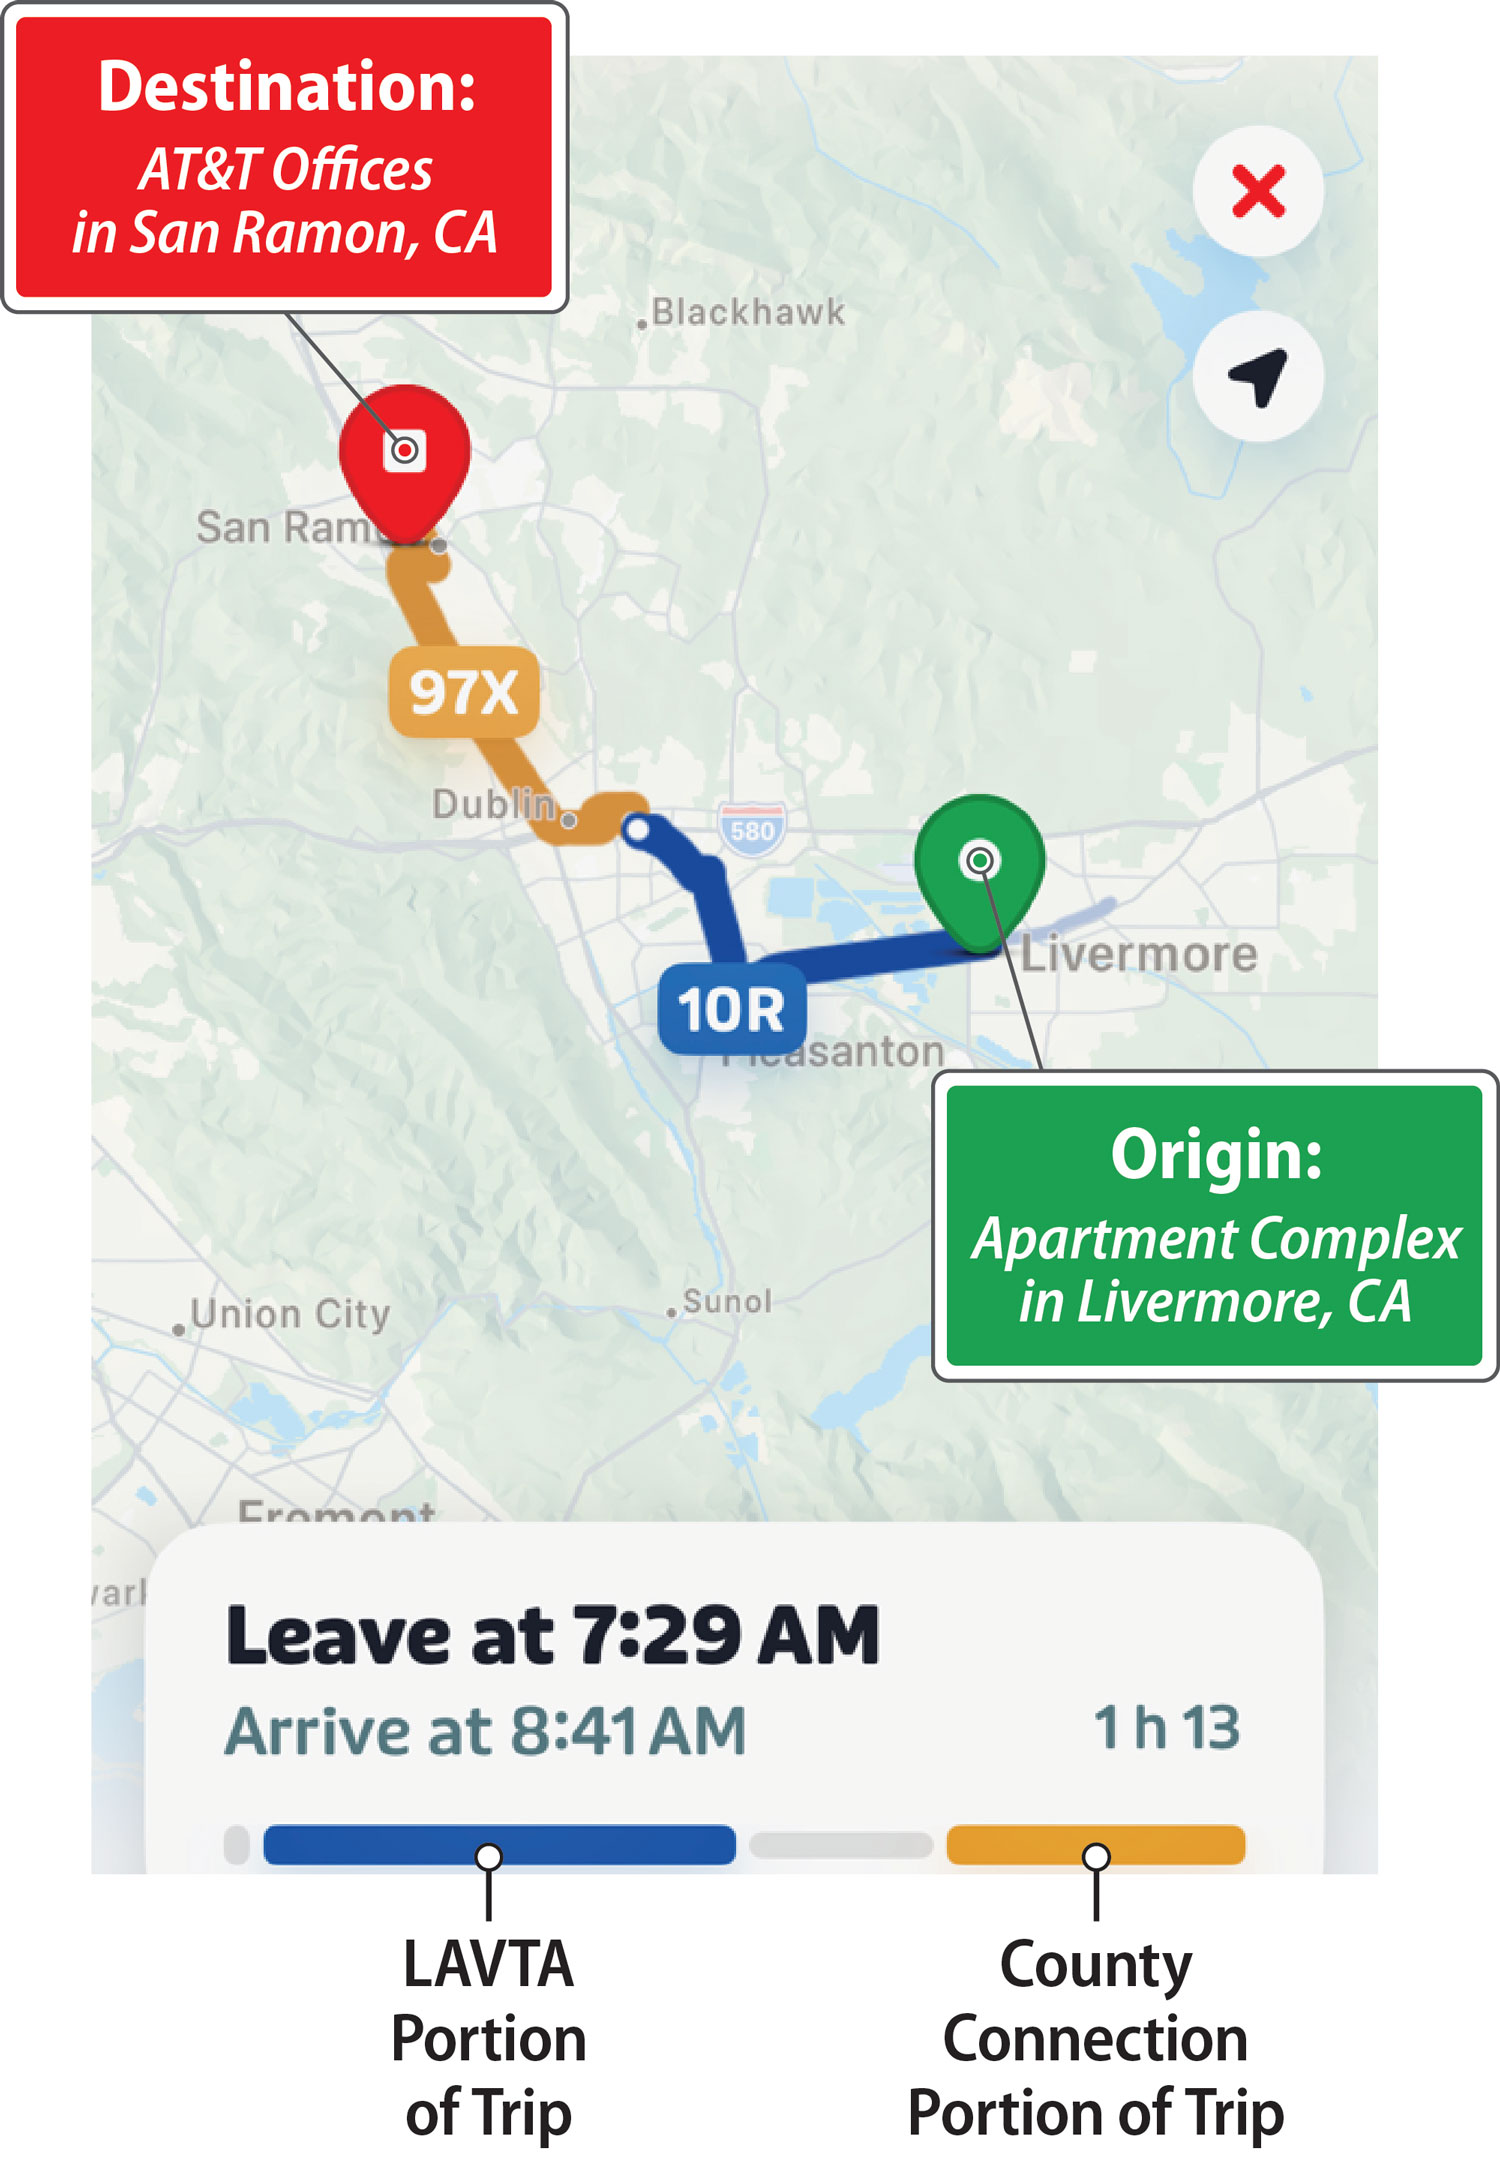
To assess the quality and ease with which riders can transfer between agency service areas, we rode a significant portion of the relevant bus routes ourselves. In total, we boarded 23 buses and several BART trains across 12 trips to identify potential problems the public may experience when making trips that require transfer from one agency’s service area to another. We selected our routes by determining reasonable trips that daily riders in the applicable service areas might take, such as from an apartment complex to a corporate office or from a residential neighborhood to a California State University campus. Some of the trips involved transfers from one agency to another, including to a BART train, whereas a few only involved transfers within the agencies’ own respective service areas. Figure 5 displays an example of a trip we took that crossed service areas and required a transfer between agencies. We tested trips from Wednesday through Friday between 7:30 a.m. and 5 p.m. To ensure that the selected trips reflected varied rider experiences at different times of day, six of our trips began in the morning, and the remaining six trips began in the afternoon. Across these 12 trips, we rode approximately 25 percent of the East Bay transit agencies’ routes that cross into other transit agency service areas.
Figure 5
Example of Auditor Trip Across Multiple Transit Agencies
Source: Transit App screenshot of auditor trip.
The Transit app screenshot shows that the auditor trip originated at an apartment complex in Livermore, CA, at 7:29 AM, using LAVTA’s 10R bus route. The auditor transferred in Dublin, CA, to County Connection’s 97X bus route and arrived at the destination of AT&T offices in San Ramon, CA at 8:41 AM, for a total trip length of 1 hour and 13 minutes.
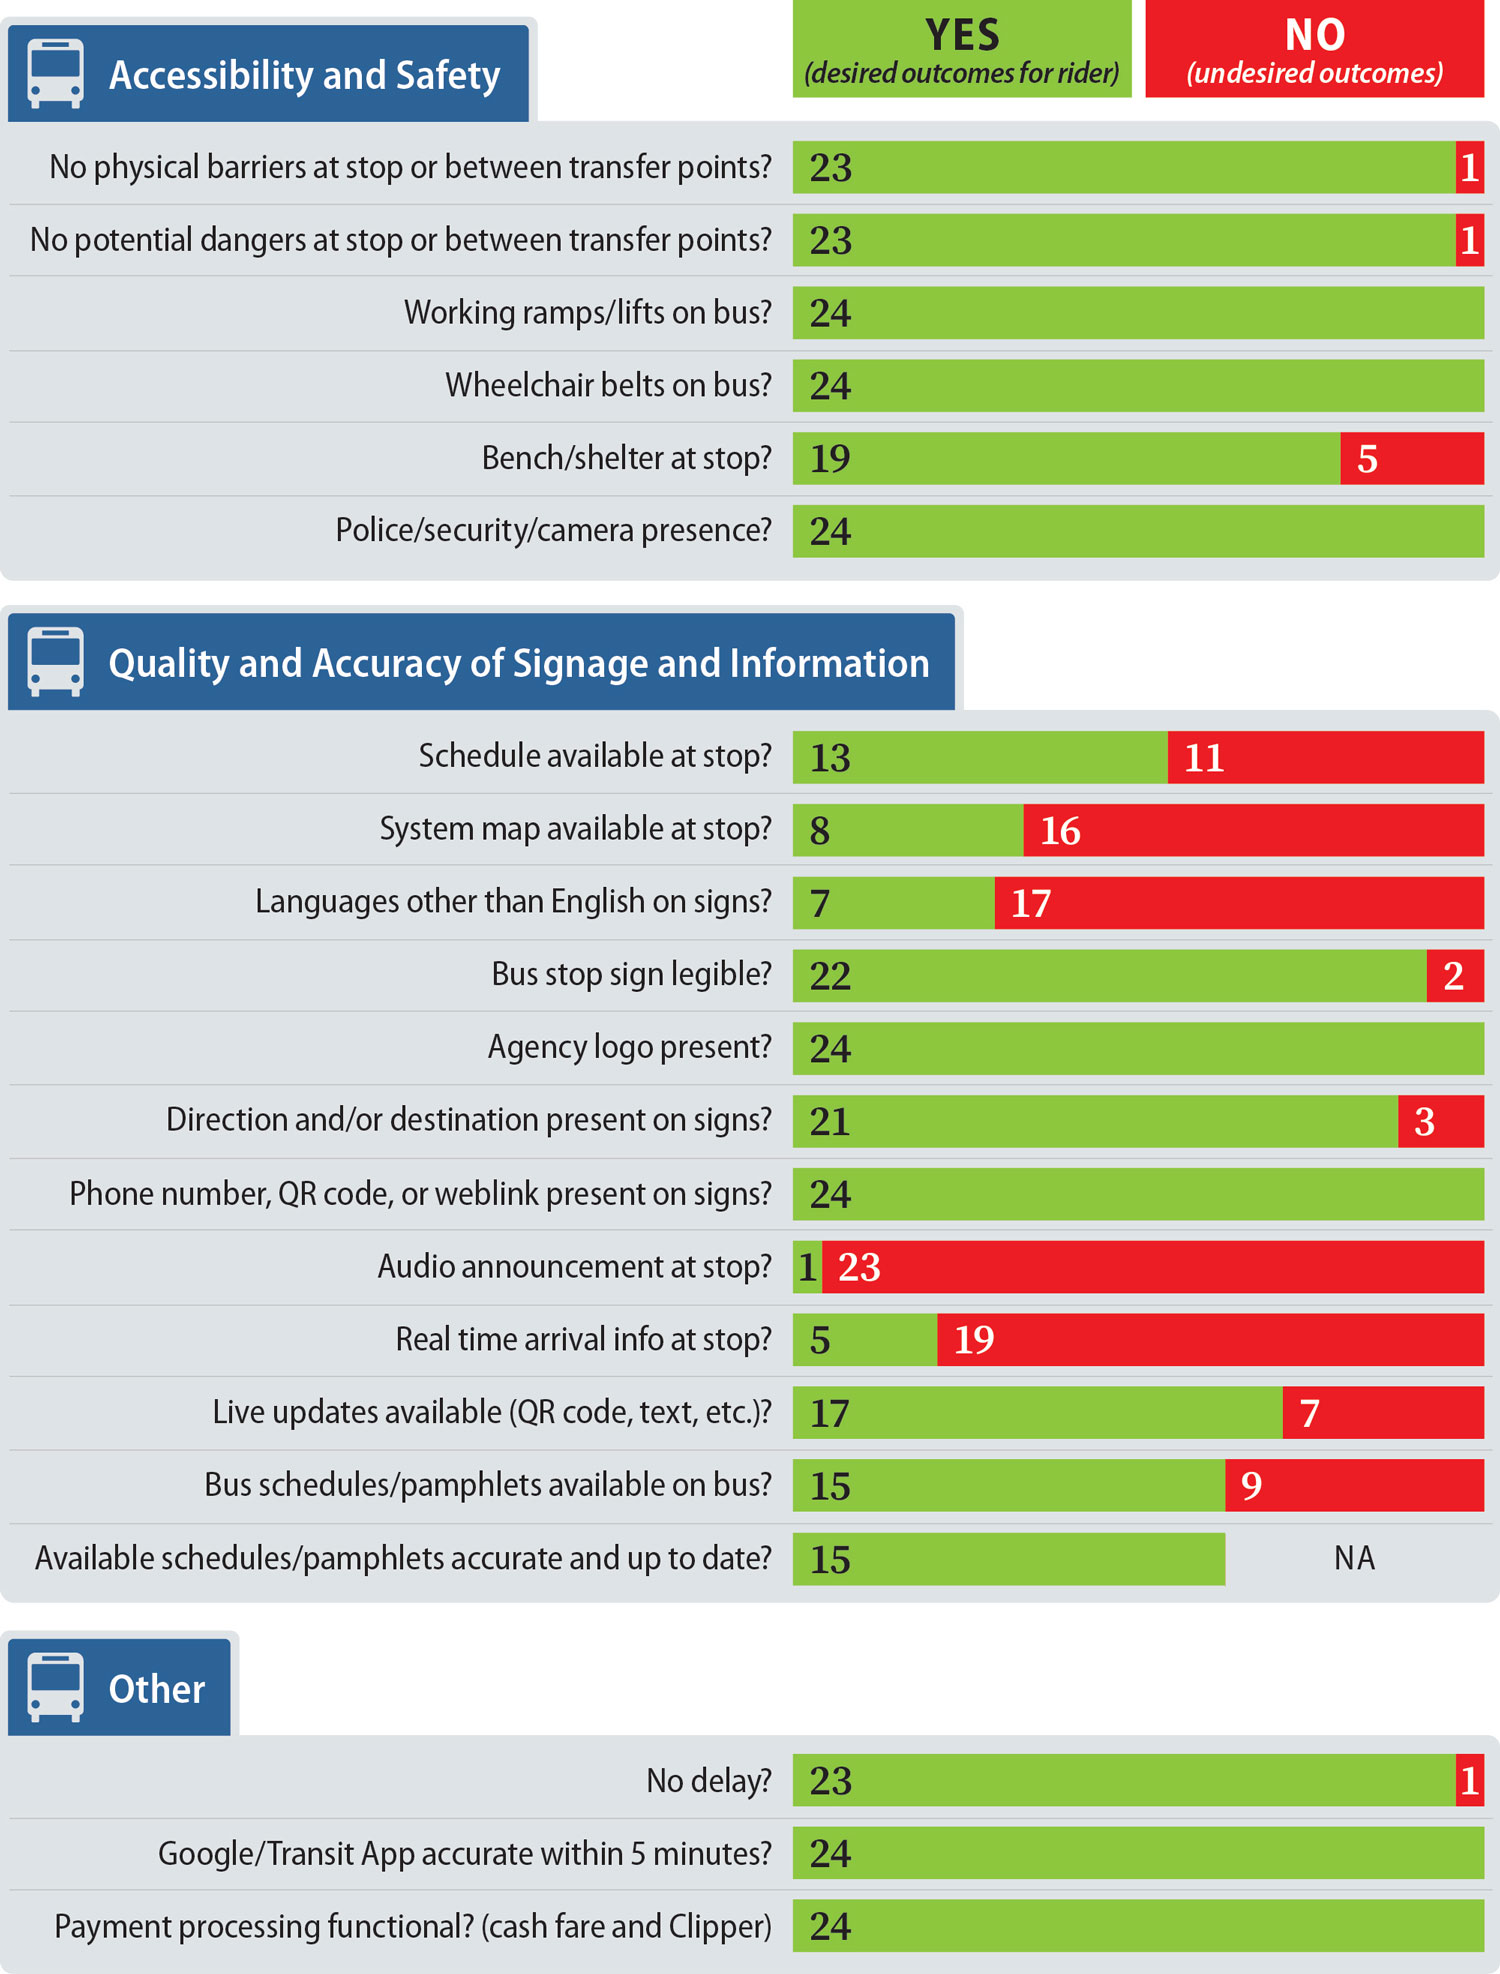
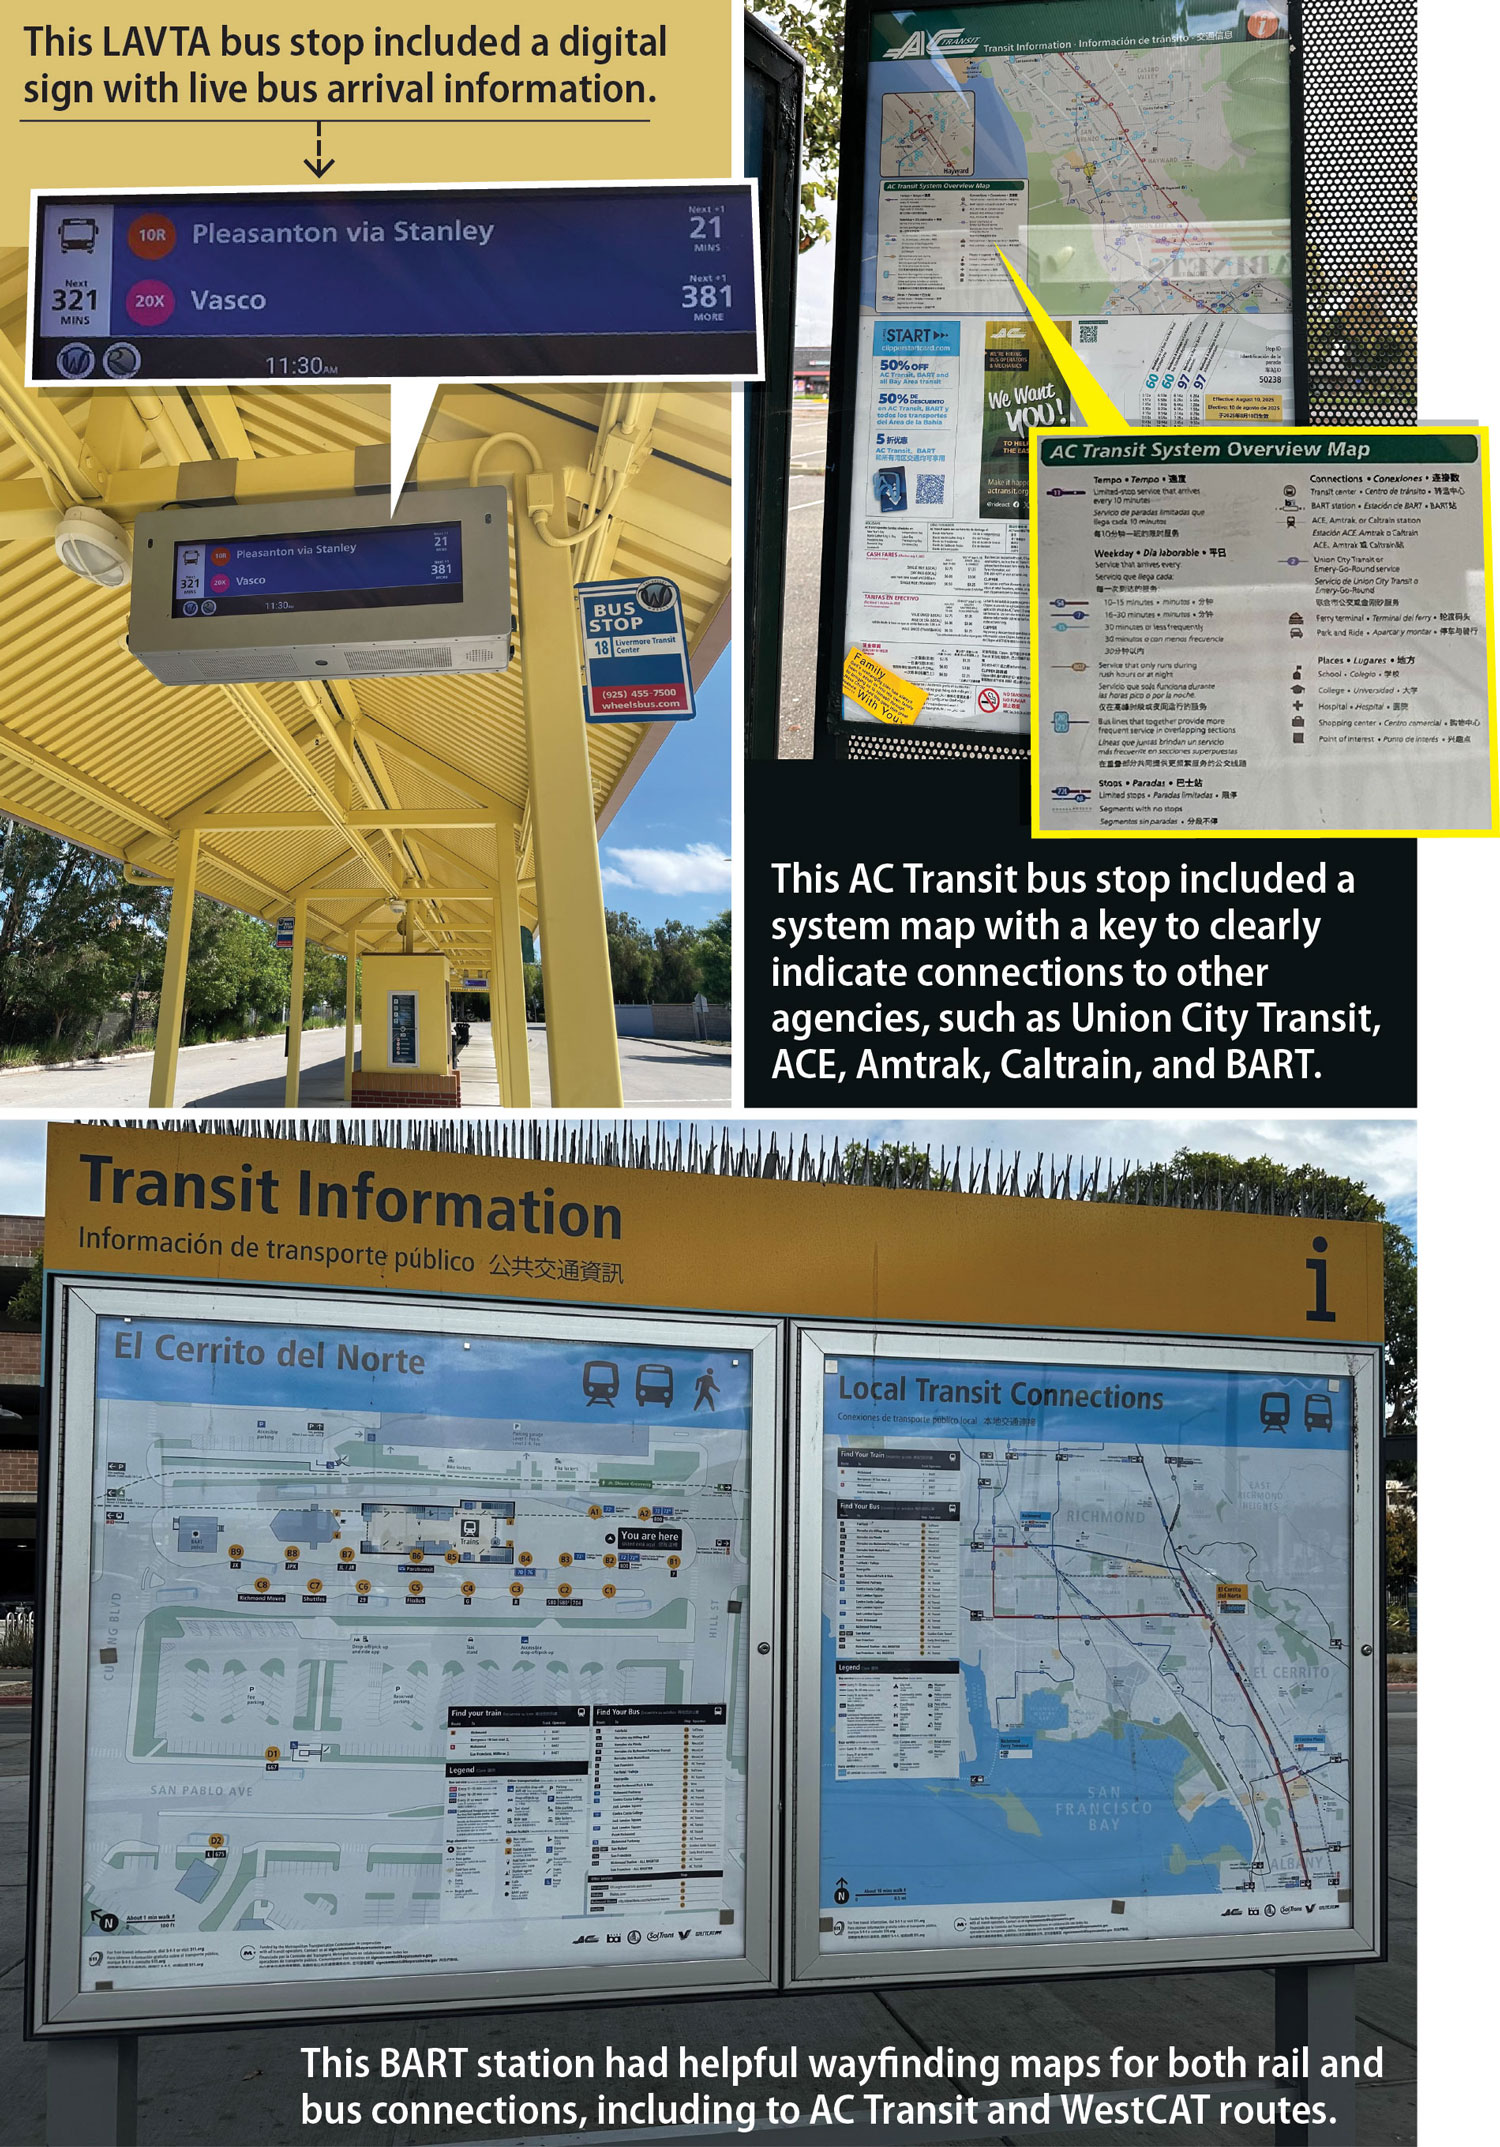
Most bus stops had information available that would help a transferring rider. For example, as Figure 6 demonstrates, all 24 bus stops we reviewed posted customer service phone numbers, website addresses, or QR codes, which link riders to schedule and transfer information, and 13 displayed bus schedules. As Figure 7 shows, some agencies also display real-time arrival information at certain stops. This figure also shows how some agencies provide system maps, which can include local transit connections. As Figure 8 shows, additional information about bus services is readily available online and easily accessible through a smartphone using third-party apps like Google Maps or Transit, which provide fairly accurate real-time information. These various resources allowed us to complete our transfers with minimal issues.
Figure 6
Most of the 24 Bus Stops We Visited Had Some Information and Resources for Riders and Were Generally Accessible
Source: Auditor observations, documentation collected from transit agencies on buses, and Google Maps/Transit App.
NA = Not applicable.
Bus stops with the answer “Yes” indicate desirable outcomes for riders, whereas “No” indicates undesirable outcomes.
Accessibility and Safety <h1>
No physical barriers at stop or between transfer points? 23 “Yes” 1 “No”
No potential dangers at stop or between transfer points? 23 “Yes” 1 “No”
Working ramps/lifts on bus? 24 “Yes”
Wheelchair belts on bus? 24 “Yes”
Bench/shelter at stop? 19 “Yes” 5 “No”
Police/security/camera presence? 24 “Yes”
Quality and Accuracy of Signage and Information <h2>
Schedule available at stop? 13 “Yes” 11 “No”
System map available at stop? 8 “Yes” 16 “No”
Languages other than English on signs? 7 “Yes” 17 “No”
Bus stop sign legible? 22 “Yes” 2“No”
Agency logo present? 24 “Yes”
Direction and/or destination present on signs? 21 “Yes” 3 “No”
Phone number, QR code, or weblink present on signs? 24 “Yes”
Audio announcement at stop? 1 “Yes” 23 “No”
Real time arrival info at stop? 5 “Yes” 19 “No”
Live updates available (QR code, text, etc.)? 17 “Yes” 7 “No”
Bus schedules/pamphlets available on bus? 15 “Yes” 9 “No”
Available schedules/pamphlets accurate and up to date? 15 “Yes” 9 “N/A”
Other <h3>
No delay? 23 “Yes” 1 “No”
Google/Transit App accurate within 5 minutes? 24 “Yes”
Payment processing functional? (cash fare and Clipper) 24 “Yes”
Figure 7
Some Bus Stops Had Signage That Provided Arrival or Wayfinding Information to Assist Riders With Transfers
Source: Auditor site visit photographs.
Photo 1: This LAVTA bus stop included a video screen with live bus arrival information, showing that the next 10R bus to Pleasanton via Stanley would arrive in 21 minutes and the next 20X bus to Vasco would arrive in 381 minutes.
Photo 2: This AC Transit bus stop included a system map with a helpful key to clearly indicate connections to other agencies, such as Union City Transit, ACE, Amtrak, Caltrain, and BART.
Photo 3: This BART station had helpful wayfinding maps for both rail and bus connections, including to nearby AC Transit and WestCAT routes.
Figure 8
Google Maps and Transit Apps Facilitate Ease of Transfer
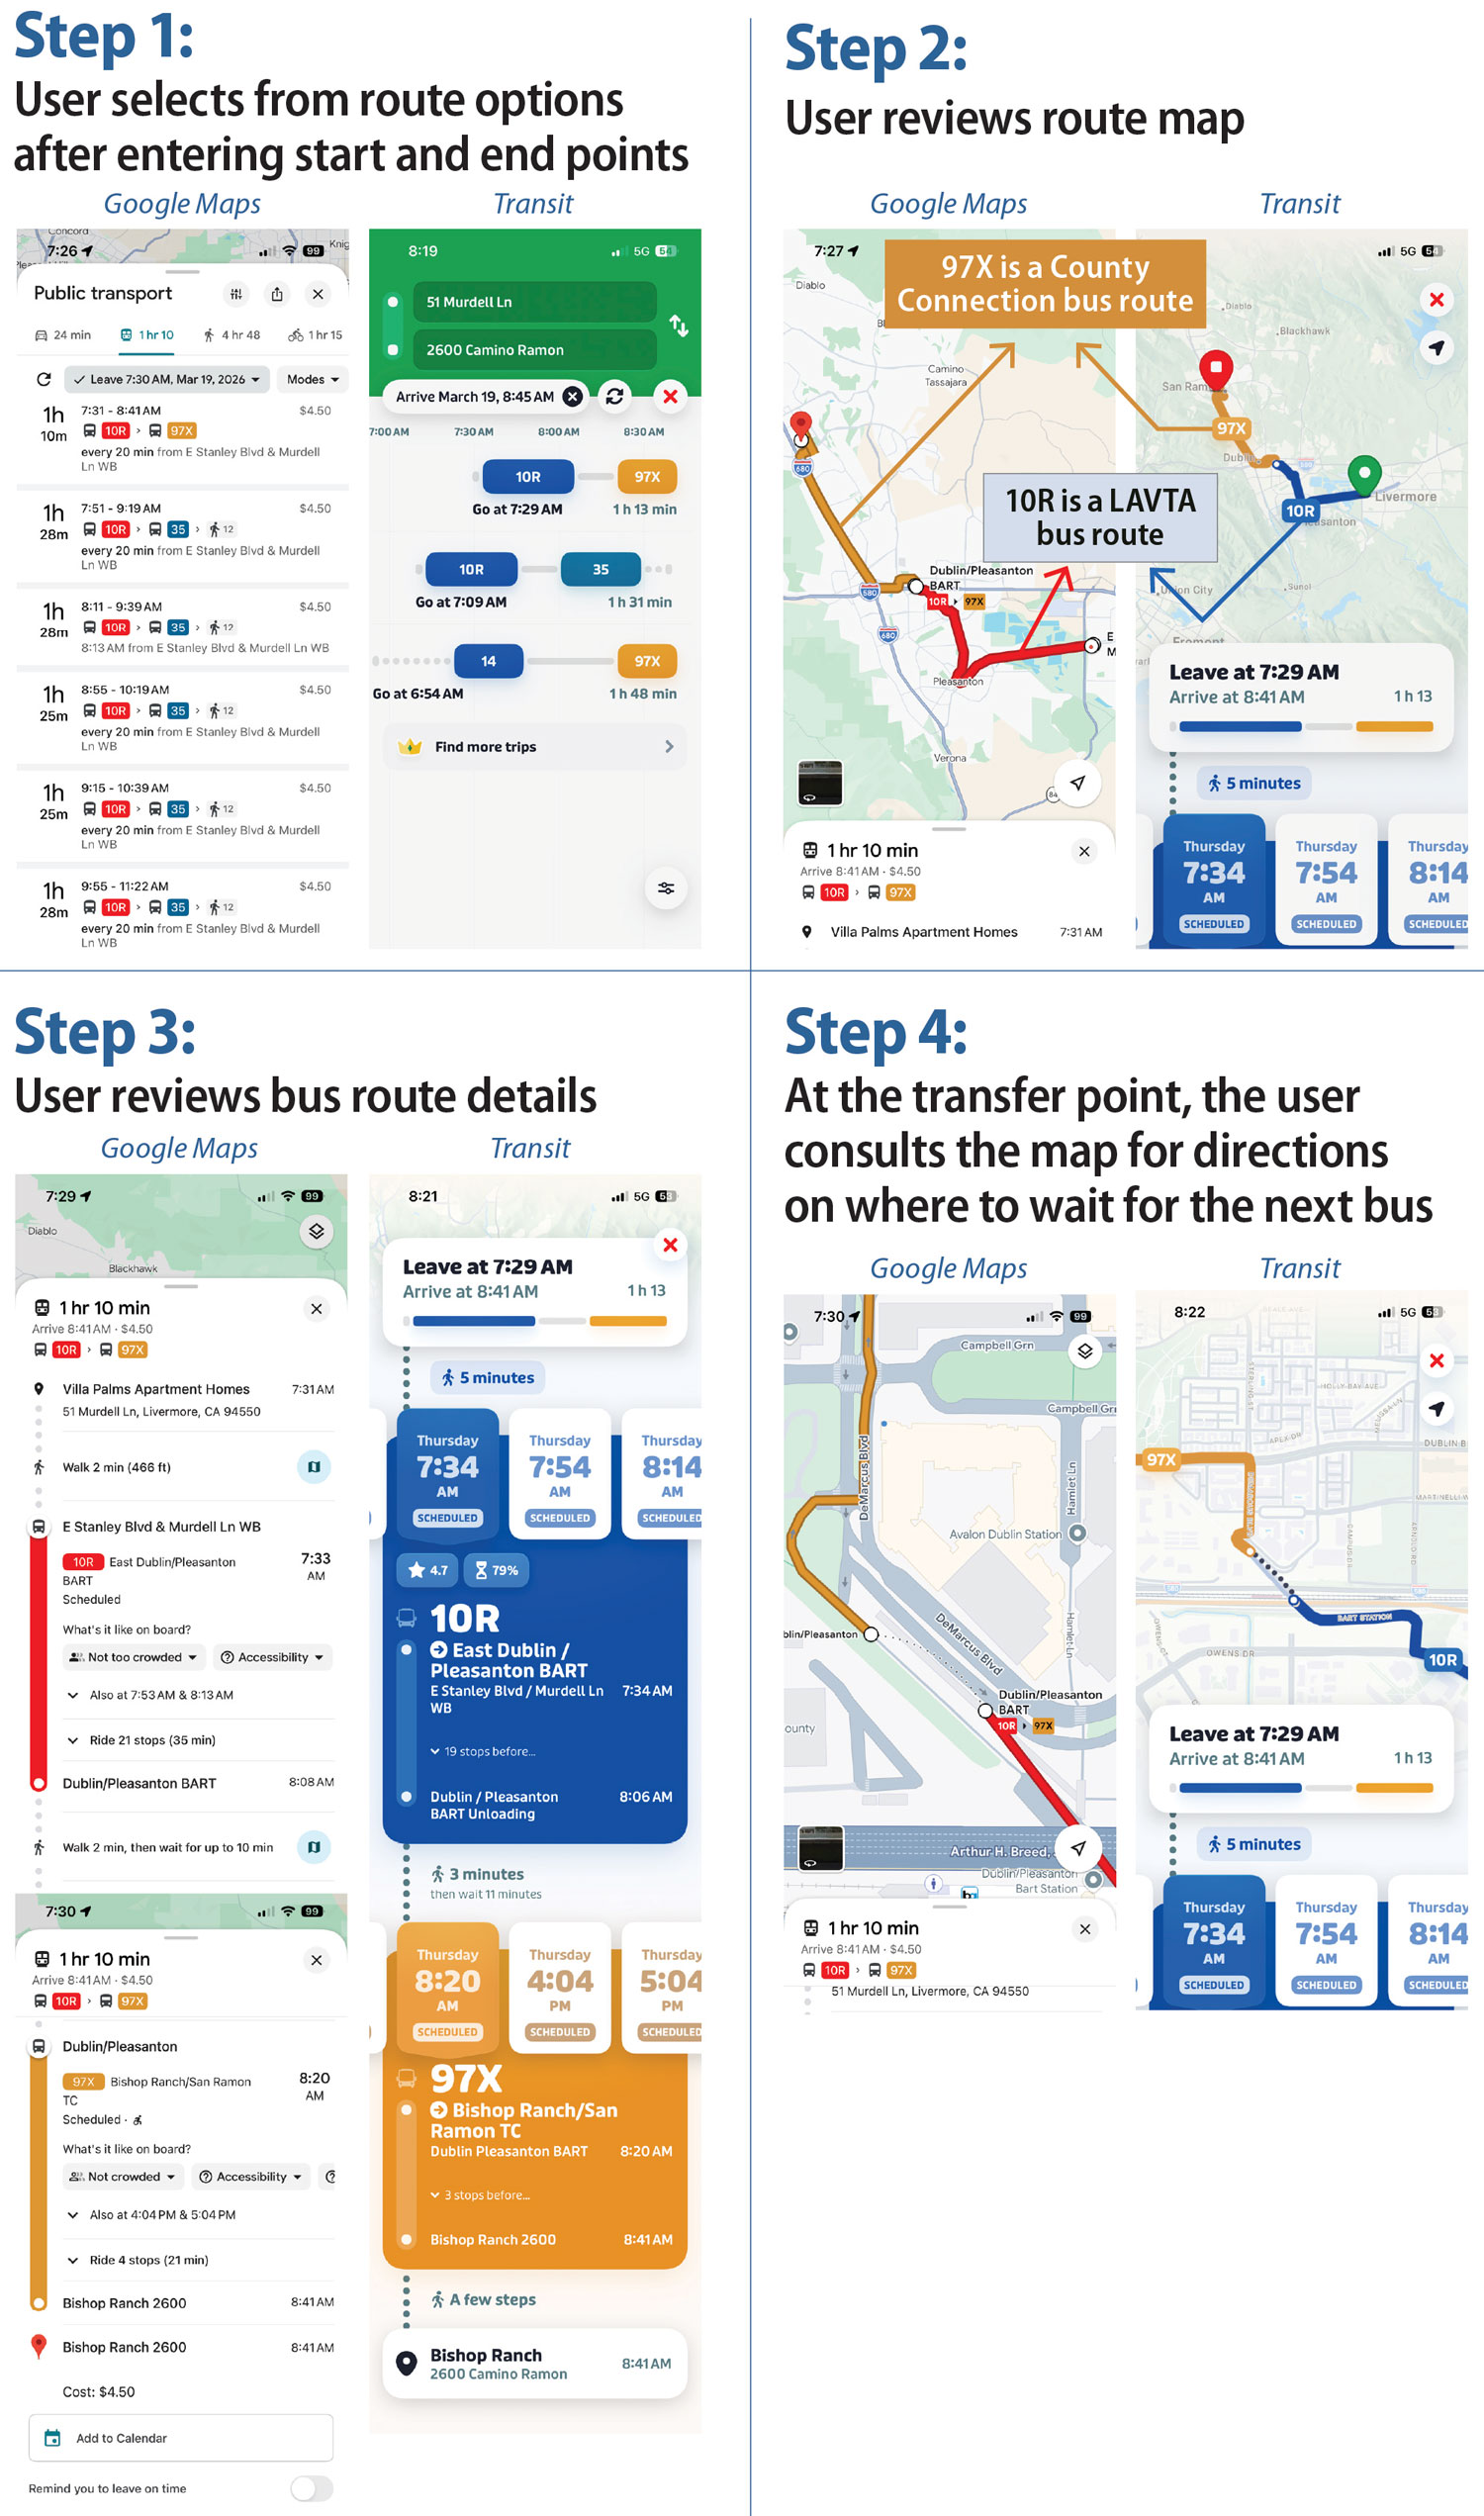
Source: Auditor-generated screenshots of Google Maps and Transit mobile apps.
This is the same trip described in Figure 5.
Step 1: User selects from route options after entering a start and an end point.
Both screenshots from Google Maps and Transit apps show the route options available after entering in your origin and destination with varying route options, starting times and trip lengths.
Step 2: User reviews route map
Both screenshots from Google Maps and Transit apps show users a map of the route they will take and indicating which leg is the first agency’s route (10R – LAVTA) and which is the second agency’s route (97X – County Connection). This map also shows the transfer point at in Dublin.
Step 3: User reviews bus route details
Both screenshots from Google Maps and Transit apps allow users to view the complete trip details, such as whether there are any walking portions of the trip and the number and location of the stops bus along each leg of the trip.
Step 4: At the transfer point, the user consults the map for directions on where to wait for the next bus Both screenshots from Google Maps and Transit apps allow users to view a map of the transfer point so that they can identify where the first bus will drop passengers off and where the next bus will pick up passengers.
Ease of payment further allowed for a straightforward transfer process. All six agencies use the Clipper system to facilitate payment for bus services, along with accepting cash, and we observed that most riders use the Clipper app to pay for bus trips.2 This application automatically applies fare discounts like free or reduced‑cost transfers. Neither we nor any of the passengers we observed experienced problems paying the fare because of technical issues related to the cash fare box or Clipper readers.
We found that transferring was accessible and easy to navigate. We reviewed several measures of accessibility for individuals with disabilities, such as the legibility of signage and whether there were physical barriers at bus stops and if buses had functioning ramps or lifts. We found that 22 of the 24 bus stops had legible signage, one bus stop had a physical barrier, and all ramps and lifts were operational. We also reviewed whether information was available in languages other than English and found that seven bus stops had translated materials. Six of these bus stops belong to AC Transit, and the seventh belongs to Union City Transit. Federal and state law provide that where a substantial portion of a population served by a public agency is non-English speaking, the agency must take reasonable steps to provide information about its services in the languages of non-English speakers in the agency’s service area. However, under state law, agencies have discretion about what a substantial portion is, and neither federal nor state law provide guidance about what “reasonable steps” might include. All six of the agencies provide translations of their websites in a variety of languages, which are accessible through the URLs or QR codes on many bus stop signs. Because of the ease of payment, information available about transferring between agencies, and accessible bus stops, we did not encounter significant obstacles during our trips.
Signage Quality at Bus Stops
Although most bus stops had information available, many lacked bus schedules, making it more challenging for riders who may lack access to a smartphone. At 13 of the 24 bus stops we reviewed, the transit agency provided bus schedules. For the remaining 11, that information was only available through a phone number, website link, or QR code. Although the Consumer Affairs website estimates that 98 percent of Americans have a cell phone, and that more than 90 percent of Americans own a smartphone, some riders may prefer or need schedules and maps at bus stops.
On one of the 12 trips, we could not complete our trip on time because a bus was canceled. For this trip, the second segment was on an AC Transit bus, but it did not arrive as scheduled. In this instance, we were able to obtain information about the canceled bus by using Google Maps on our smart phones. To continue with our trip, according to that application, we would have needed to wait for the next bus, which would have arrived 20 minutes later. A rider without a smartphone would not have learned this information as easily. When asked about the incident, AC Transit’s manager of business analytics told us that the bus was canceled because a driver had called to say that they would not be working that day, and there were not enough standby drivers scheduled that day to cover the shift. The manager noted that AC Transit riders can receive service alerts through mobile apps or call 511 or the customer service number listed on bus stops. AC Transit additionally provides real-time service updates on canceled trips on its website. Once a bus is canceled, riders can decide whether to wait for the next bus or make alternative travel arrangements to reach their destination. Of the remaining 23 buses that we boarded, there were no delays and arrival times posted to Google Maps and Transit were accurate within five minutes.
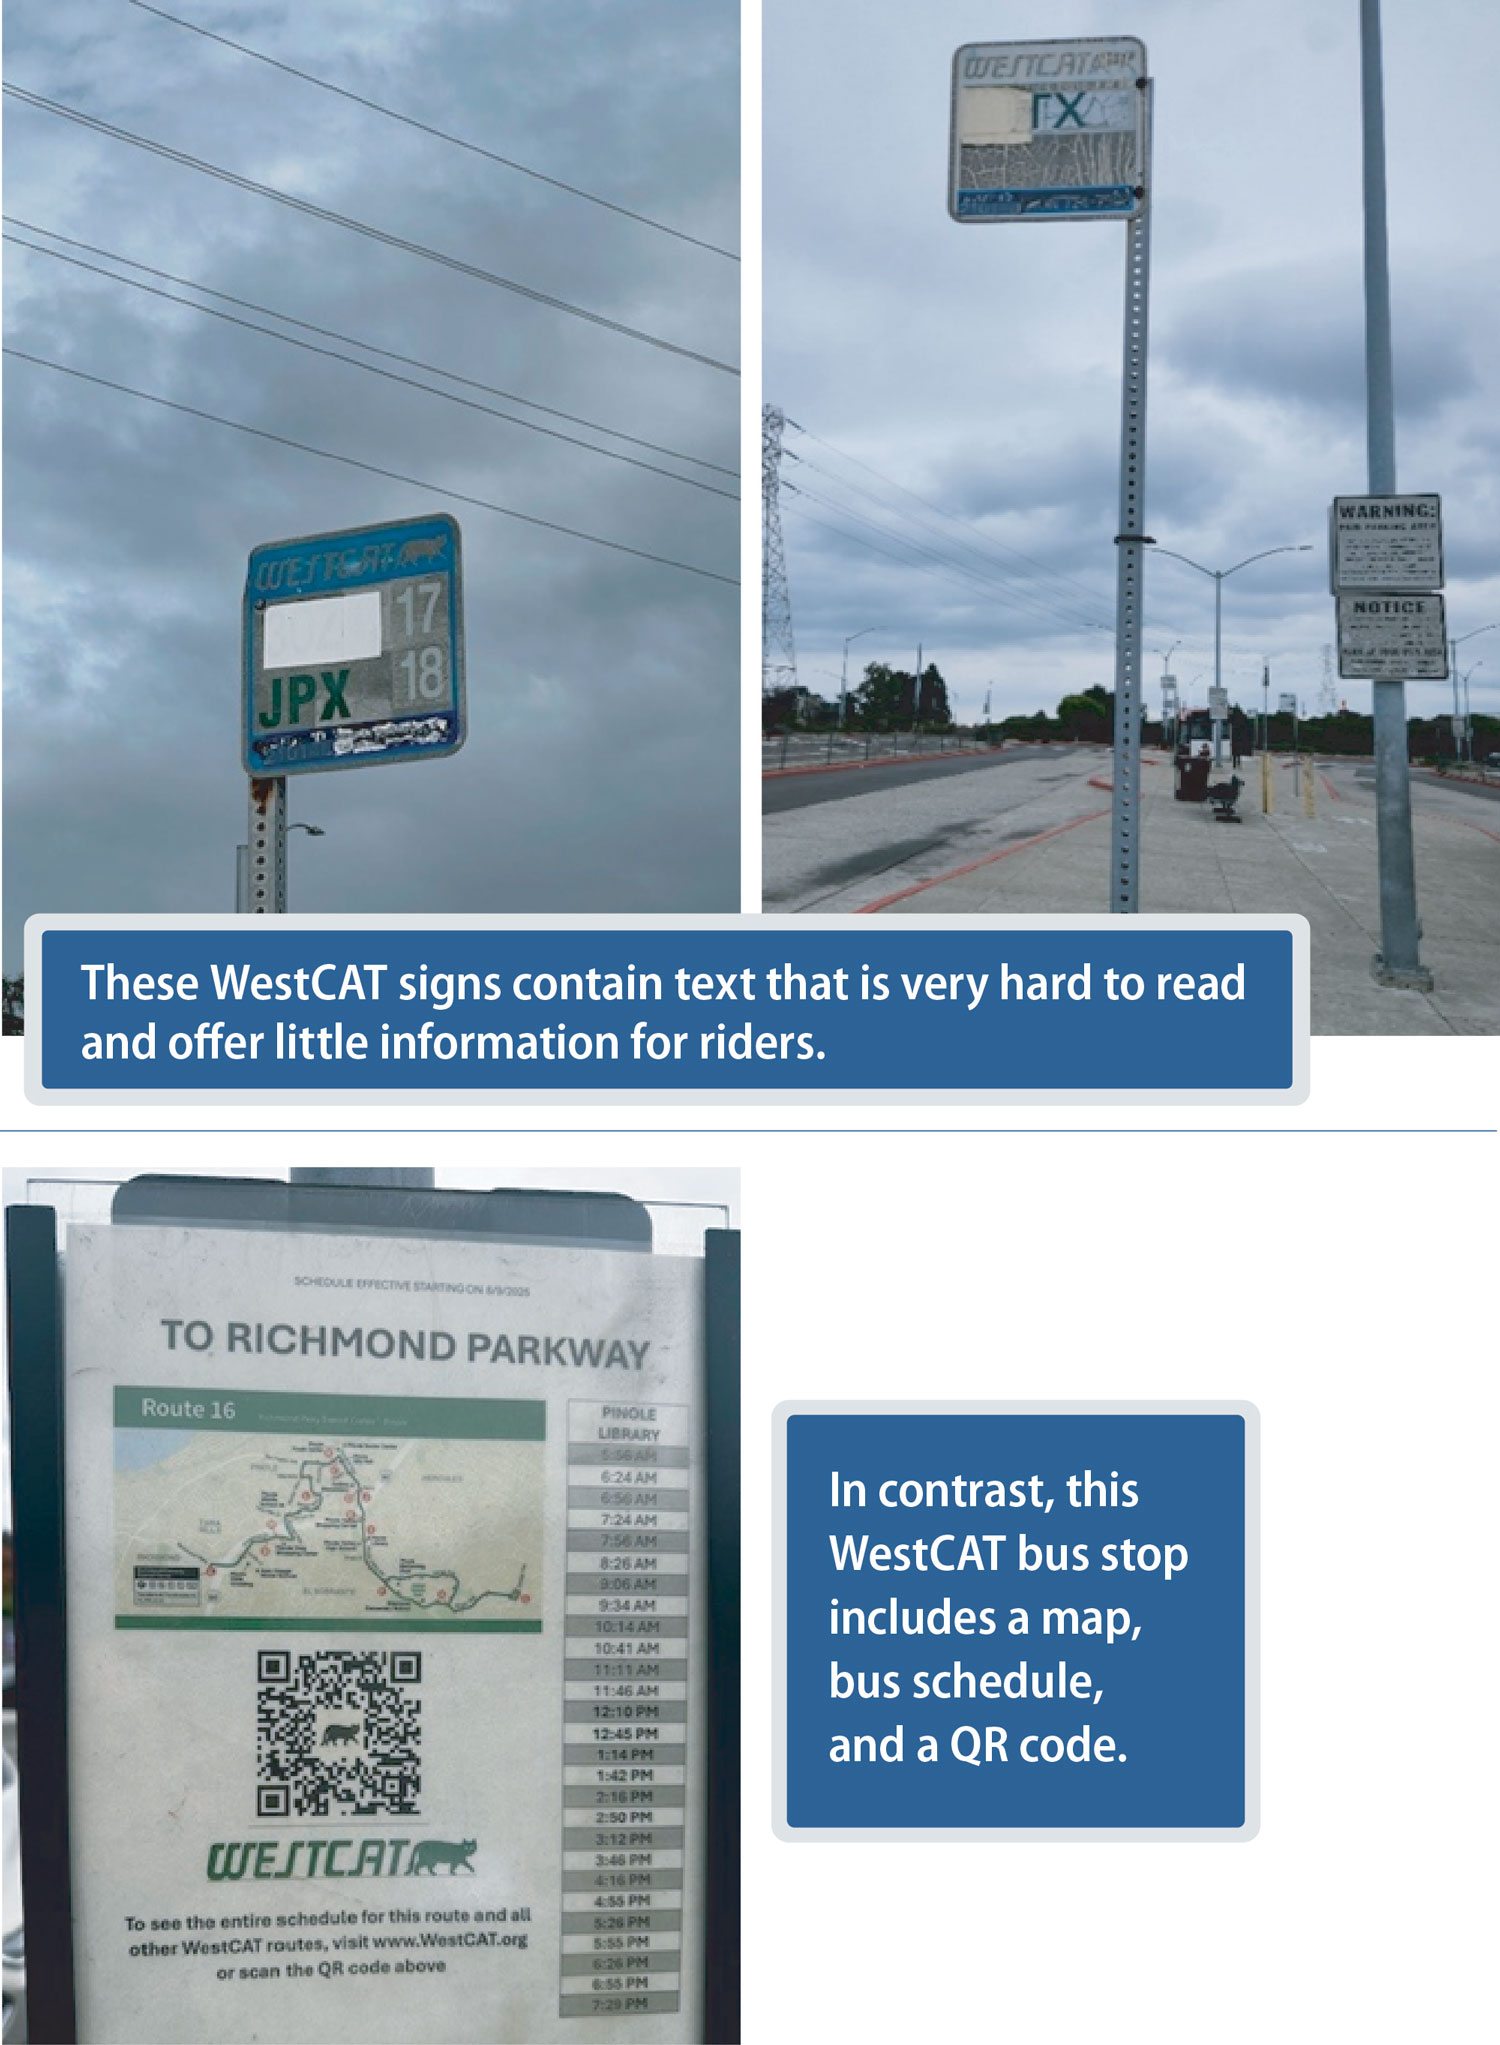
Although most of the agencies provided basic and reliable information at bus stops, we concluded that WestCAT could improve the quality of its signage at some stops. As Figure 9 demonstrates, signage conditions varied widely. Specifically, at two of the five WestCAT bus stops we visited, available information, such as an agency phone number, was very difficult for riders to see. Additionally, three of the five WestCAT bus stops we visited lacked information on the direction or destination of the bus route serving that stop, a problem we did not observe at any other agencies’ bus stops. When we asked WestCAT why the agency had not addressed problems with its signage in the past, its general manager noted that in the time since his appointment in 2022, WestCAT had planned to roll out updated signage once new regional guidelines became available. The general manager further speculated that in earlier years prior to his appointment, a lack of available financial resources may have held up progress on improving signage. MTC is developing standards for improved bus signage as part of MTC’s Regional Mapping and Wayfinding Project, which we discuss further under Objective 6. Although MTC had not yet issued the final standards at the time of our review through April 2026, WestCAT has received draft guidelines from MTC, and its general manager confirmed that it is currently working with County Connection, Tri Delta Transit, and MTC to implement updated signage at shared stops in Martinez as part of the Regional Wayfinding and Mapping Project. WestCAT also plans to update all current bus stop signage in conjunction with service changes slated for early 2027. Nonetheless, until the new signage is installed across all bus stops, new riders unfamiliar with WestCAT may struggle to understand how and when they can reach their destinations.
Figure 9
WestCAT Bus Stops Had Both Illegible and Good Signage
Source: Auditor site visit photographs.
The first two photos are WestCAT signs that contain text that is very hard to read and offer little information for riders. The third photo shows a WestCAT bus stop that includes a map, bus schedule, and a QR code.
Overlapping Service Areas
We reviewed bus system maps for the six agencies and identified that only AC Transit, Union City Transit, and WestCAT are at risk of duplicating services because their service areas overlap. The other East Bay transit agencies we reviewed either operate primarily in their service area or provide feeder service directly to rail stations such as BART and Amtrak. Using the system maps of the three relevant agencies, we judgmentally selected three bus stops shared by AC Transit and Union City Transit and three bus stops shared by AC Transit and WestCAT. We then identified all bus routes that use the selected stops and compared the geographic coverage of the routes, such as shared origin or destination stops or other overlap along routes, to determine if there was any duplicative service.
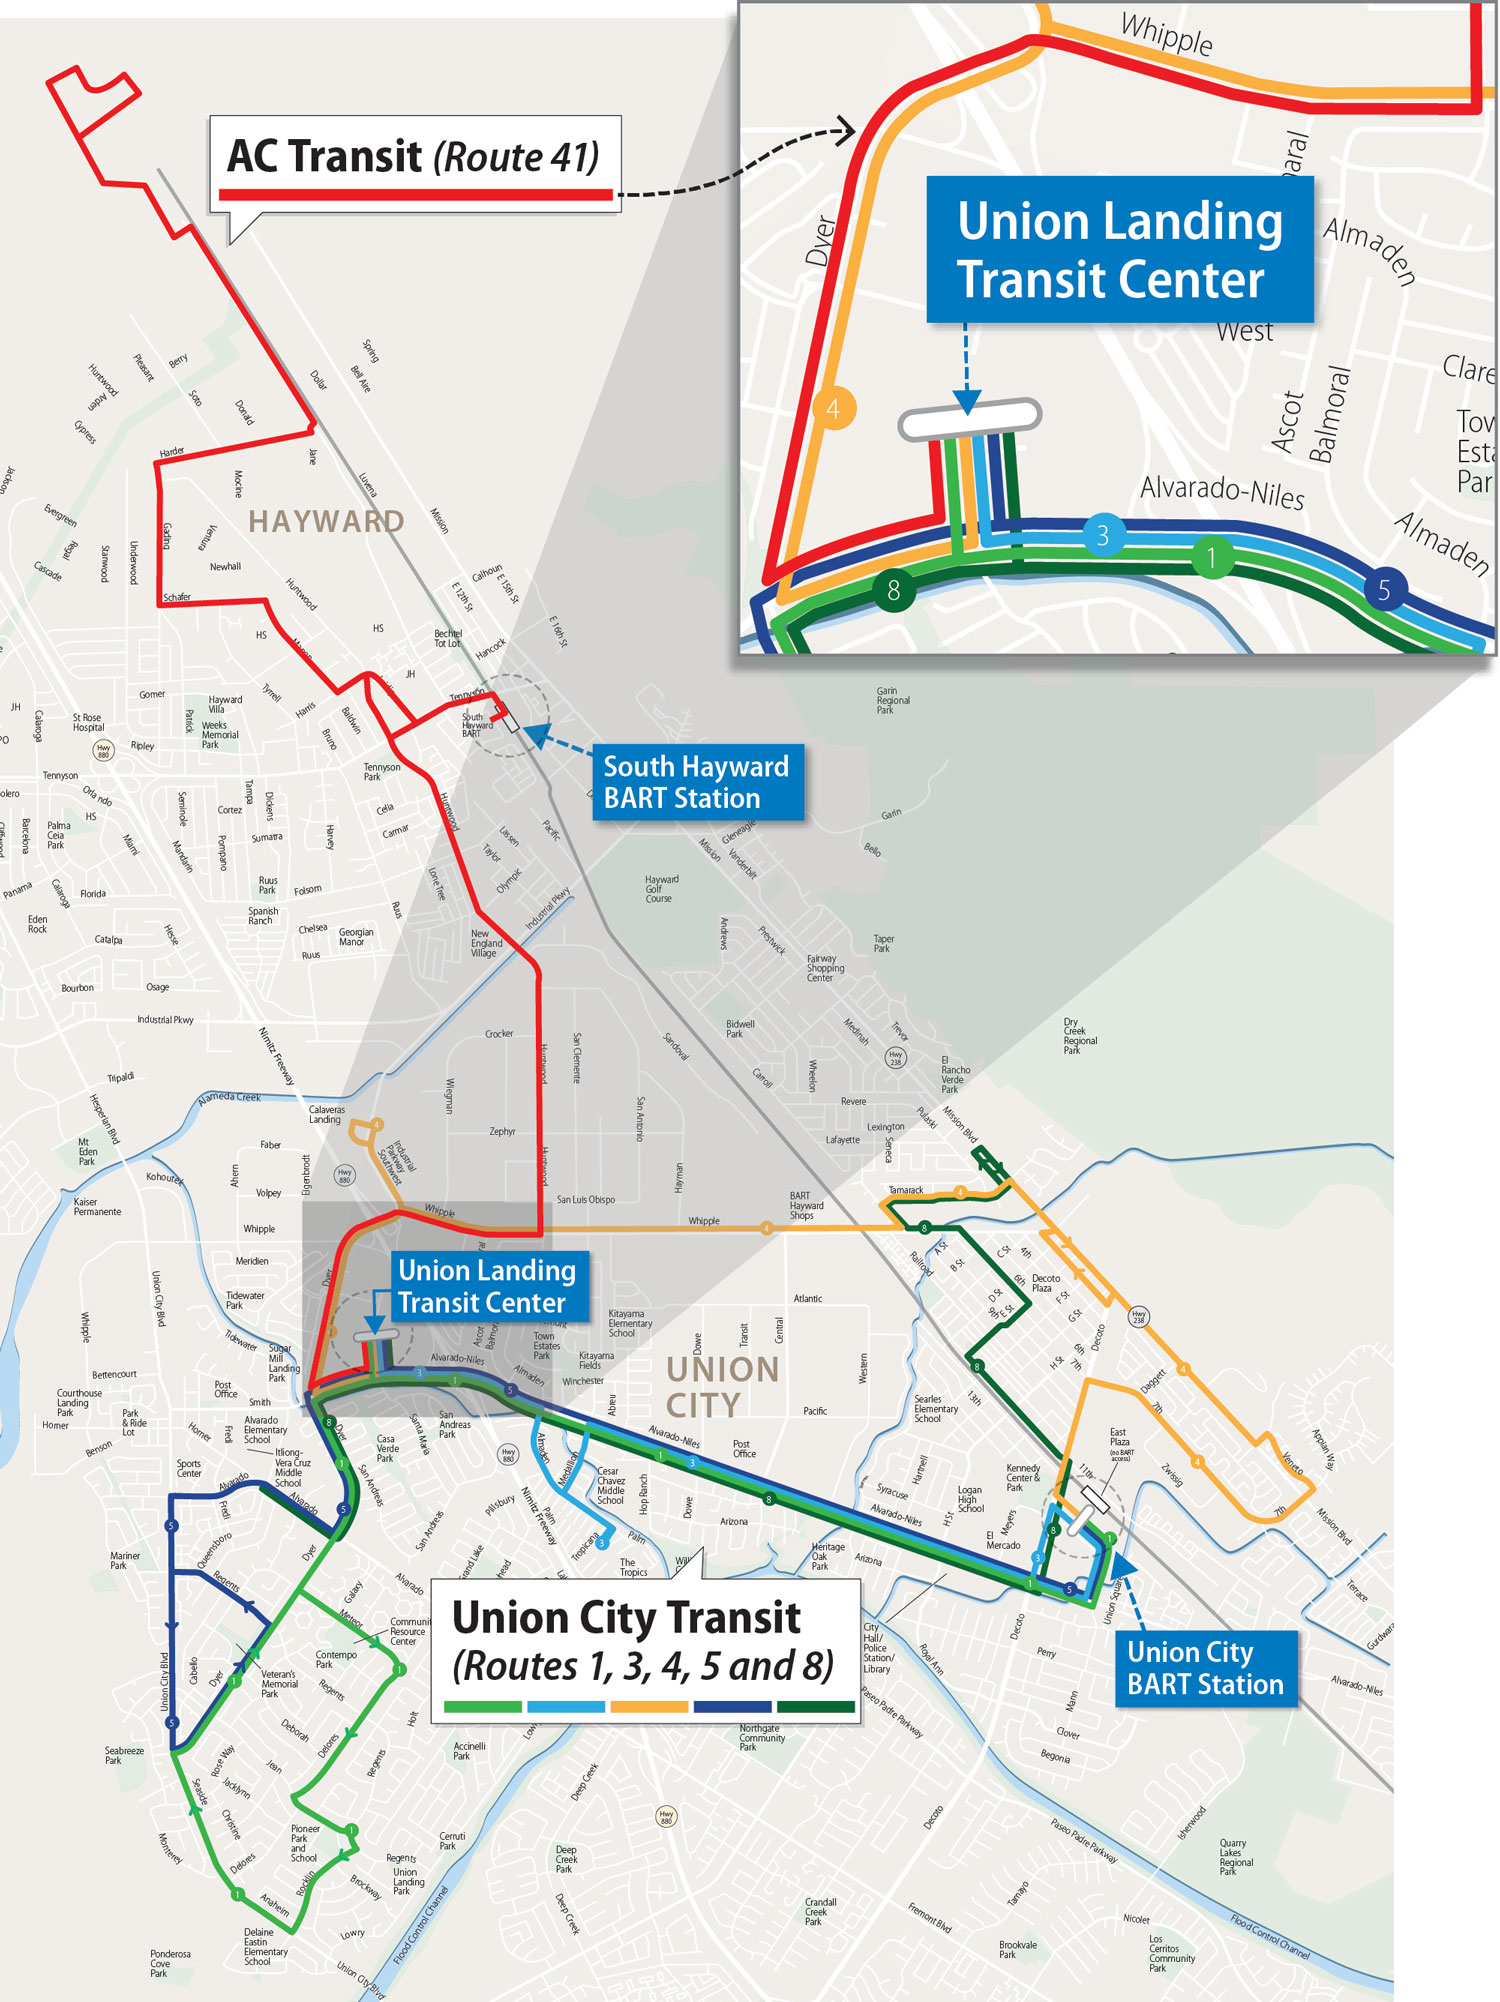
Although AC Transit and Union City Transit routes have some overlap, these routes ultimately serve different populations and locations and are not duplicative. As Figure 10a shows, Union City Transit operates around Union City. AC Transit, in contrast, serves populations that leave or enter Union City, transporting riders to and from surrounding areas such as Fremont’s Ohlone College and BART stations in Hayward and San Leandro. We concluded that AC Transit’s and Union City Transit’s routes are not duplicative, although they share some stops, such as a transit center and a BART station.
Figure 10a
AC Transit Bus Route Does Not Duplicate Union City Transit Service Because It Extends to Another City
Source: AC Transit and Union City Transit maps.
A map of the Union City and Hayward areas that shows in the southwestern part of Alameda County showing that Union City Transit routes 1, 3, 4, 5, and 8 overlap with AC Transit route 41 briefly in Union City at and around the Union Landing Transit Center. The map shows how the routes are otherwise duplicative because the AC Transit route extends significantly northward to another city, Hayward, whereas the Union City Transit routes remain in Union City.
Similarly, although AC Transit and WestCAT share some stops, we did not identify duplicative services among the selected routes. As Figure 1 shows, WestCAT’s service area extends eastward to cities that are outside of the AC Transit service area, such as Hercules. Likewise, AC Transit extends its services into areas that are not served by WestCAT, including Berkeley and Oakland. AC Transit and WestCAT both provide bus services to some of the same locations, such as the Richmond Parkway Transit Center shown in Figure 10b, which provides a connection point for riders who live in one part of the county and commute to another part of the county. We determined that the overlap of routes near connecting transit centers is both logical and minimal. We found that the AC Transit and WestCAT routes that share trip segments eventually branch off and use different streets and highways, allowing them to serve different neighborhoods and populations.
Figure 10b
AC Transit and WestCAT Use the Same Transit Center and Mall Without Duplicating Service

Source: AC Transit and WestCAT maps.
A map of the Pinole, Richmond, El Sobranto, San Pablo, and El Cerrito areas, which is in the northwestern part of Contra Costa county, showing that WestCAT routes 16, JR/JL, and JPX and AC Transit route 71 overlap briefly in northern Richmond at the Richmond Parkway Transit Center and around the Hilltop Mall but otherwise are not duplicative because the AC Transit route travels to the western areas of Richmond and El Cerrito. The WestCAT routes primarily serve the Pinole area, except for the segment that extends to El Cerrito Del Note BART station, which the AC Transit route does not serve.
Objective 6:
Does MTC Facilitate Effective Collaboration in the Bay Area?
To determine whether MTC’s efforts to collaborate and coordinate with selected agencies were effective, we reviewed two efforts that MTC leads: implementation of action items in MTC’s 2021 transit action plan, and oversight of Senate Bill (SB) 125 funding.3 We looked for evidence that MTC implemented the initiatives, had proof that outcomes benefited riders and improved transit, solicited and incorporated feedback from transit agencies, and maintained compliance with SB 125.
Implementation of Transit Action Plan
MTC stated in the transit action plan that it established a Blue Ribbon Transit Recovery Task Force in April 2020 to set a course for public transit’s recovery and long‑term improvement. MTC reported that ridership had declined by 67 percent across the Bay Area as of June 2021. MTC stated that the task force assisted in distributing federal Coronavirus Aid, Relief, and Economic Security (CARES) Act relief funds and sought to improve the Bay Area transit network by developing a transit action plan. The task force acknowledged that challenges existed prior to the pandemic, such as rider safety concerns and declining ridership despite increases in transit service. The transit action plan focused on desired outcomes such as simpler, consistent, and equitable fare and payment options that attract more riders and integrated mapping and real-time schedule information that makes navigating transit easier for both new and existing riders. It then identified near-term actions targeted for completion in one to three years that would constitute substantial progress toward these outcomes.
We determined that MTC actively facilitated coordination and collaboration with transit agencies as it worked to achieve progress on its transit action plan items, but it could improve its effectiveness in implementing timely actions. We selected nine of 27 actions from MTC’s transit action plan that focus on improving the rider experience, which we display in Table 4.
To evaluate MTC’s coordination with transit agencies, we developed a set of criteria focused on the rider experience and tangible outcomes. The text box lists some of the criteria we used to evaluate MTC’s coordination in achieving the action items. We then reviewed evidence to determine the completion date of each selected action item. We found that MTC funded projects, sought stakeholder input, and solicited feedback throughout implementation. Transit agencies actively provided feedback through meetings and working groups. MTC reviewed feedback from agencies and, in some cases, the public through surveys. This demonstrates that MTC actively facilitates coordination with transit agencies and collaborates with them to implement transit initiatives.
Criteria for Our Evaluation of MTC’s Coordination
What was the outcome on wayfinding for passengers?
Were fare coordination and integration recommendations passenger-focused?
Have consistent wayfinding standards actually been adopted and implemented?
How did the strategies benefit customers?
Were all selected transit agencies participating in each action item, and what feedback did they provide?
Source: Auditor-developed criteria.
Projects implementing some actions have recently led to positive changes for riders, including improved signage using new regional standards and reduced fares. One action, the Regional Wayfinding and Mapping Project, requires MTC to finalize regional mapping and wayfinding standards for application across all service areas. State law provides MTC with broad discretion to coordinate transit in the region but does not specify that MTC must adopt regionwide signage standards. This ongoing effort includes coordination across stakeholder groups, advocacy organizations, and transit agencies. MTC used draft standards to implement map and signage prototypes at transit stations in El Cerrito in December 2024 and Santa Rosa in February 2025. MTC surveyed the public once before and once after installing prototypes using these new design standards. Rider responses after implementation were positive, with survey results indicating that wayfinding was easier for people using the prototype signs and maps than it was before installation. MTC noted that it will periodically update its mapping and wayfinding design standards and that it plans to implement the standards incrementally across the region in 2026.
In coordination with developing the regionwide standards, another action item requires MTC to fund one to three North Bay and East Bay mapping and wayfinding projects. MTC expanded this effort to nine projects, including multi-modal transit hubs. MTC cited feedback from transit agencies and its evaluation of prototypes as reasons for this expansion. MTC also obtained feedback from transit agencies on draft signage. Transit agencies provided comments that included accessibility and coordination considerations for stops used by multiple agencies.
Another action item asked MTC to act on recommendations from a Fare Coordination and Integration Study, which included a recommendation to implement a discounted pass for riders from institutions and employers, such as colleges, universities, and affordable housing properties. MTC and transit agencies collaborated to implement a pass that provided unlimited transit trips across all transit agencies that accept Clipper payments for eligible employees from these institutions. This initiative, known as BayPass, was reported to increase trips by eligible riders by 35 percent and generate approximately $1.1 million in additional fare revenue.
Although MTC collaborated effectively with agencies to achieve progress on several actions, it did not complete them according to its original schedule. As Table 4 shows, of the nine actions that we reviewed, MTC completed none of them by the preliminary targets it established, although some of the action items changed significantly after it established the target. MTC acknowledged that the timelines it set were ambitious and were intended as preliminary targets subject to continued evaluation and refinement. MTC adjusted its own internal timelines as necessary. For example, MTC changed the mapping and wayfinding action item and its timeline significantly after it established the target. However, it was unclear to the public that these adjustments had occurred because MTC did not publish that information on its web page for the action plan. MTC published a work plan in July 2025, and it promised an update to its transit action plan in early 2026. As of February 2026, MTC had not identified a date for publishing this update.
MTC did not adopt performance measures with quantifiable metrics for the actions that we reviewed until 2024. The transit plan items we reviewed directed MTC and stakeholders to take action to fund and develop projects and outlined expected outcomes, such as increased equity and simpler, consistent payment options that attract more riders. However, MTC did not include specific requirements or metrics, such as increases in new riders on existing routes, for each of the actions it planned to take. Instead, it produced a Regional Network Management framework in February 2023 to help achieve the outcomes of the transit plan. MTC later adopted performance measures in May 2024 to evaluate the Regional Network Management framework’s progress, such as on-time transit performance and availability of real‑time data. MTC contracted with a consultant in June 2025 to gather data and analyze results from these measures but has otherwise not established specific requirements or procedures for each of its planned action items.
Oversight of SB 125 Regional Accountability Measures
The governor approved SB 125 in July 2023. State law requires the California State Transportation Agency to establish an accountability program to govern the disbursal of $4.4 billion in SB 125 funding. MTC is charged with governing the disbursal of $1.1 billion of this funding for the Bay Area. The California State Transportation Agency disburses funding to regional transportation planning agencies to fund transit operations or qualifying capital improvements. State law requires the California State Transportation Agency to develop guidelines for the administration of this funding in consultation with transportation planning agencies, transit agencies, and other entities. In November 2023, MTC approved principles to inform SB 125 funding disbursal, as shown in the text box. MTC developed these principles in partnership with Bay Area transit agencies and stated that funding should incentivize accountability of transit agencies to improve coordination and the customer experience. The regional accountability measures encourage progress toward regional transit improvements by making certain SB 125 funding contingent on MTC’s determination of satisfactory progress.
MTC’s SB 125 Distribution Principles
- Address the most dire shortfalls and avoid service cuts.
- Prioritize high-ridership agencies.
- Prioritize service for transit-dependent riders.
- Incentivize transit operators to improve coordination and customer experience.
- Minimize impact to capital and equipment repair programs.
Source: MTC Resolution.
Using the funding principles listed above, MTC disbursed SB 125 funds to four of the selected East Bay transit agencies: AC Transit, LAVTA, Tri Delta Transit, and WestCAT. MTC’s director of funding policy and programs stated that MTC has fully disbursed SB 125 funds for transit operations, and there is no remaining funding. MTC developed three checklists that the transit agencies used to demonstrate compliance with accountability measures associated with this funding. One checklist tracked participation in regional initiatives, such as fare coordination working groups and mapping and wayfinding projects, and two other checklists focused on schedule coordination and transit data availability. To determine whether MTC’s oversight is effective and if the agencies performed required activities, we verified the validity of the responses that the four agencies provided to 40 checklist questions. In all cases, we found evidence that supported each agency’s responses, demonstrating that they were complying with the regional accountability measures for this funding. There were two instances in which two agencies stated that they were not actively participating in certain working group meetings related to regional initiatives, but in both cases, the agencies were not members of the respective group. Because we did not identify concerns in our analysis and because the funds have been fully disbursed, we did not perform additional work to assess the adequacy of MTC’s oversight of these funds.
Financial Condition of Transit Agencies
Key Points
- Most of the selected East Bay transit agencies have adequate financial reserves in the short term. However, rising operating costs are causing those reserves to decline, and the agencies have identified potential service cuts or fare changes that they may need to make if they cannot identify new funding. The East Bay transit agencies also anticipate challenges in meeting the State’s zero-emission vehicle purchasing requirements because such vehicles are expensive—on average twice as expensive as diesel buses.
- AC Transit, County Connection, LAVTA, Tri Delta Transit, and WestCAT are at risk of exhausting their reserves, some as early as fiscal year 2026–27, if they do not identify additional funding sources. Fare increases cannot solve these deficits because most of the agencies would need to more than double their total revenue to balance their budgets.
- Because Union City Transit is a division of the city’s public works department, it experiences lower costs and overhead, and the agency thus appears financially stable and does not heavily rely on reserves. As a result, Union City Transit is unlikely to reduce service in the medium or long term.
- MTC’s roles and responsibilities for coordinating funding for the region vary depending on the funding source, but it coordinated the disbursal of more than $1 billion to the six selected East Bay transit agencies during the past three fiscal years.
Objective 5:
What Are the Transit Agencies’ Financial Conditions and Can They Afford New Buses and Expanded Services?
Transit Agency Reliance on Nonoperating Revenue
We found that all six East Bay transit agencies rely predominantly on nonoperating revenue, rather than operating revenue, to fund their services. In accordance with transit agency financial statements, we define nonoperating revenue as primarily federal, state, and local grants; taxes; and subsidies, whereas operating revenue is usually from passenger fares or other self-generated sources. We reviewed the East Bay transit agencies’ audited financial statements from fiscal years 2022–23 through 2024–25 to identify the percentage of operating revenue each of the six transit agencies received from these sources. The percentage of operating revenue ranged from 4 percent to 14 percent of total revenue, and fare revenue comprised the majority of operating revenue. Rider fares make up small percentages of transit agency revenue, as the text box demonstrates. California subsidizes public transit because it provides services to residents of all income levels and provides public benefits, such as reduced air pollution.
Fares as Percentage of Total Revenues by Agency
AC Transit – 5%
County Connection – 7%
LAVTA* – 7%
Tri Delta Transit – 6%
Union City Transit† – 4%
WestCAT – 10%
Source: Agency financial statements for fiscal year 2024–25.
* LAVTA’s director of finance confirmed that this amount for LAVTA excludes contracted fare revenue. When included, LAVTA’s fare revenue is 10 percent of total revenue.
† Based on fiscal year 2023–24 financial statements as they were the most recent available.
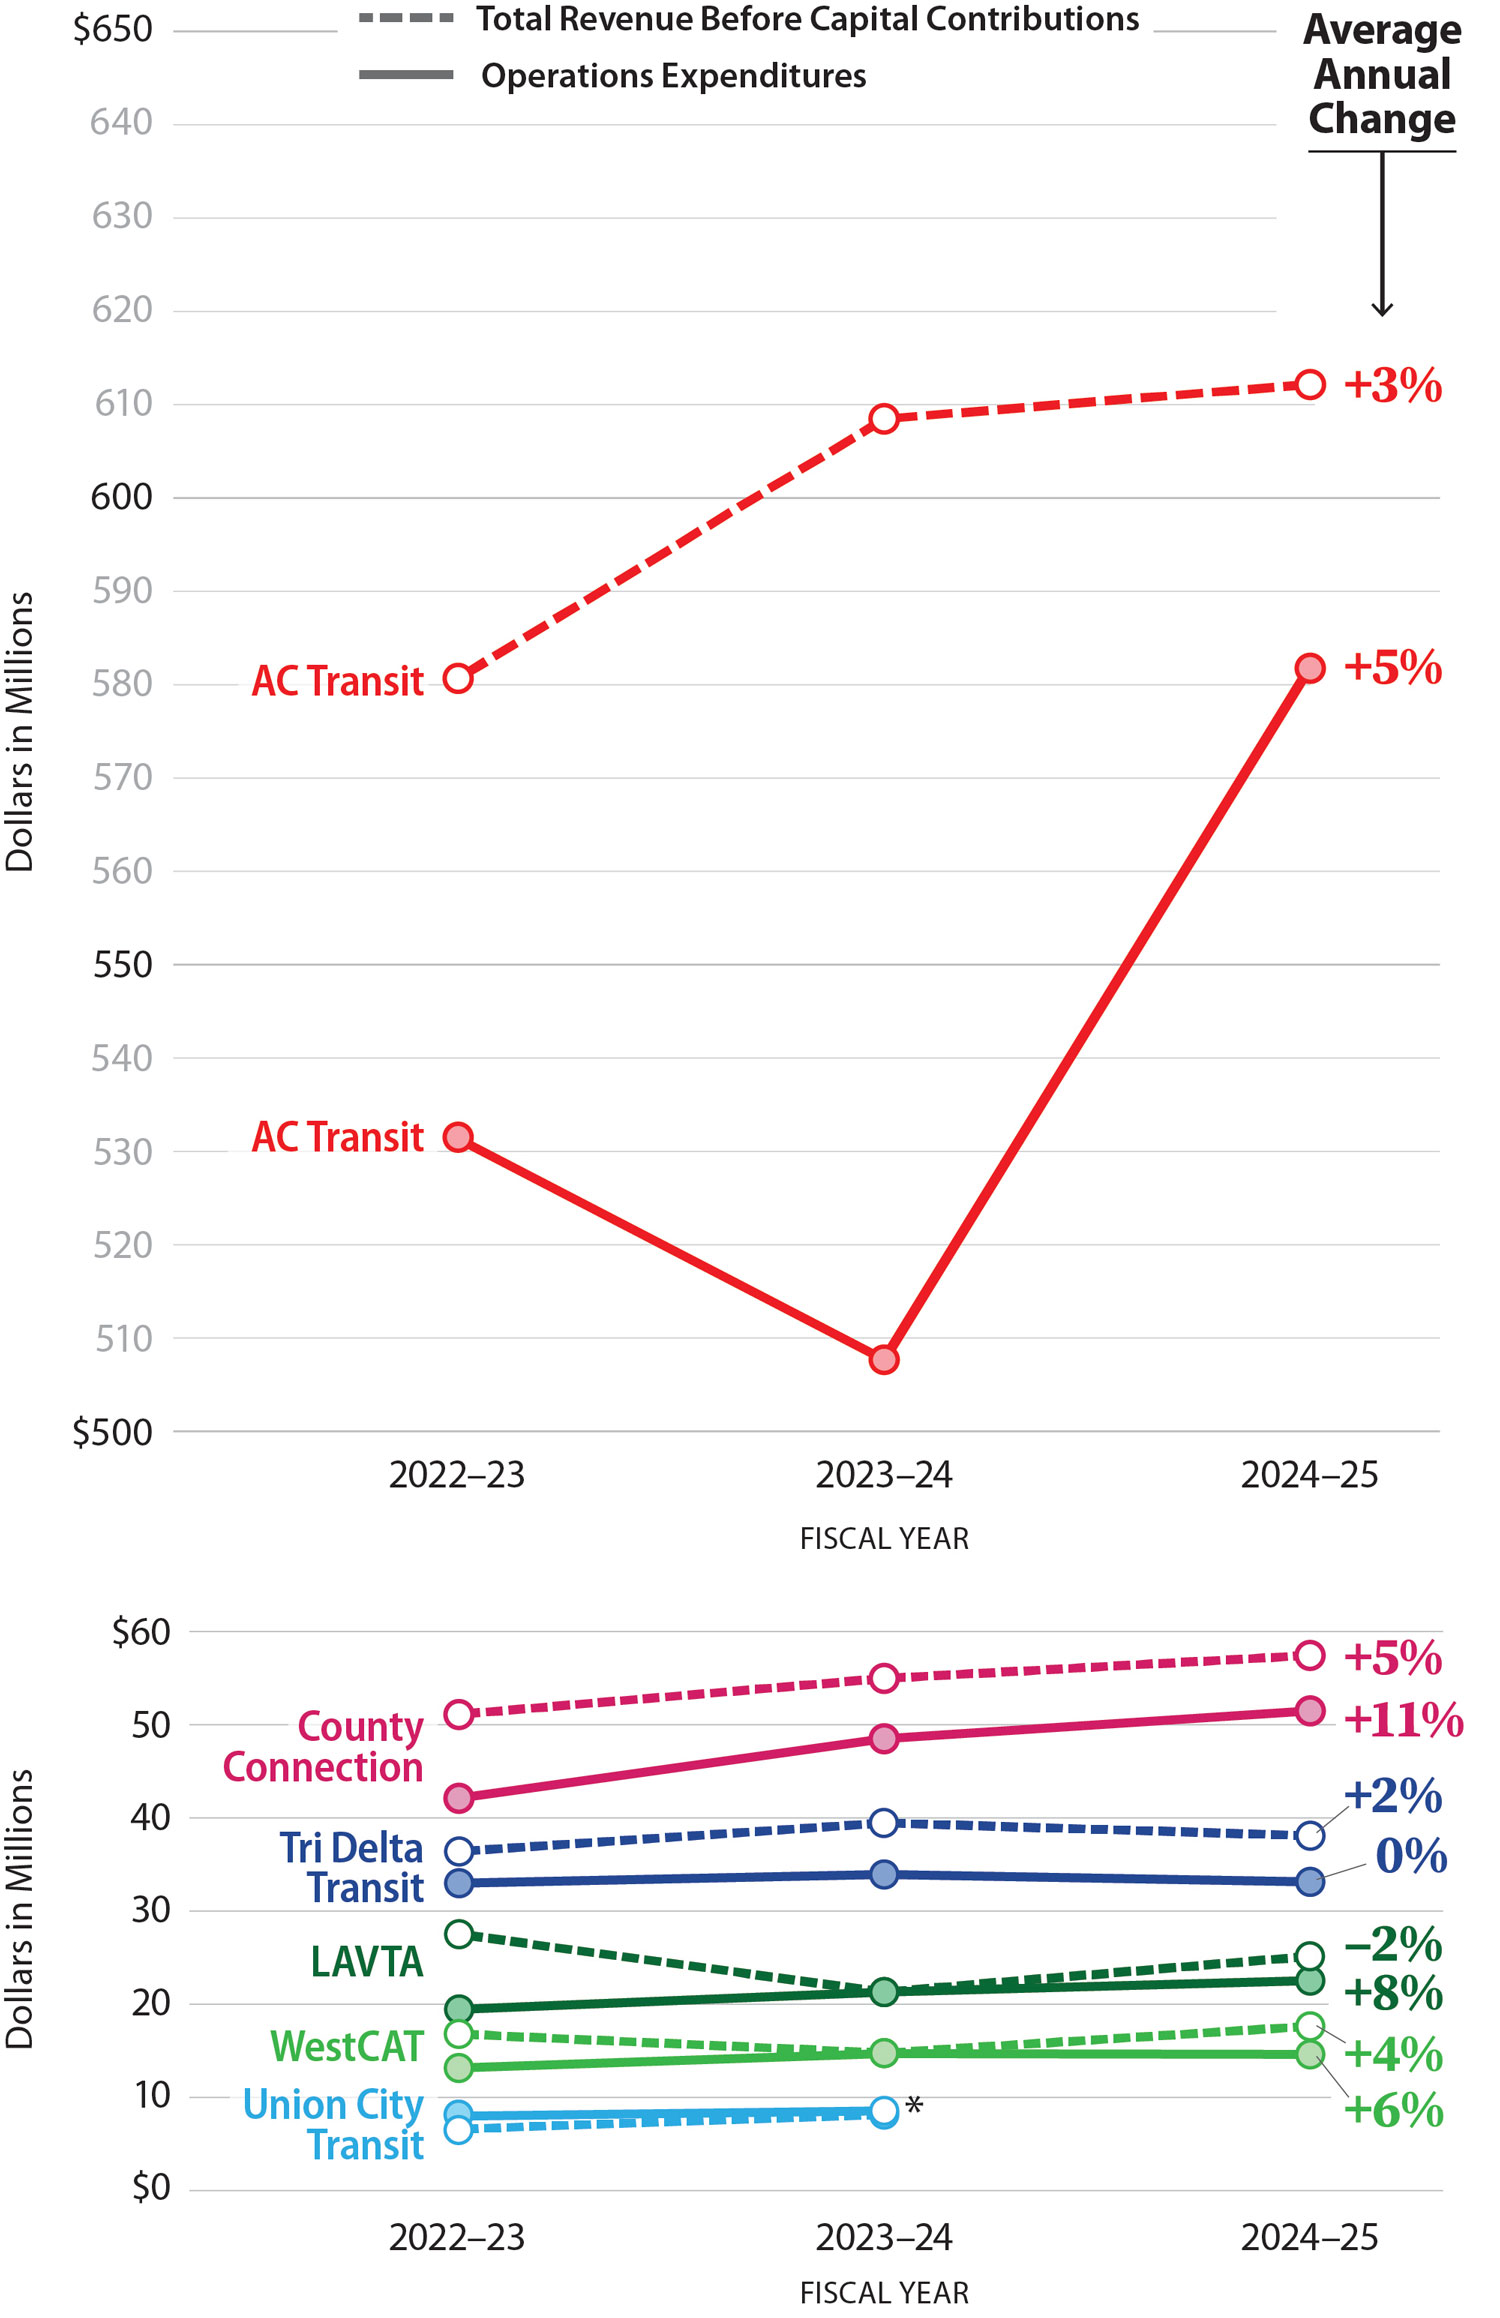
We reviewed financial trends during the last three fiscal years at the East Bay transit agencies to help determine their financial conditions and found that their heavy reliance on various subsidies for their revenue may place them at risk of cutting service if those subsidies decline or are no longer available. Revenue has changed little, ranging from a 2 percent decline to a 5 percent increase during the three years of our review, as Figure 11 shows. However, expenses, such as labor and fuel costs, increased more, ranging from 5 percent to 11 percent.4 If cost increases continue to outpace increases in revenue, East Bay transit agencies may need to cut costs.
Figure 11
Over the Last Three Fiscal Years, Growth in Expenditures Exceeded Growth in Revenue for All but One Agency
Source: Auditor analysis of agencies’ audited financial statements for fiscal years 2022–23 through 2024–25, as well as AC Transit’s draft fiscal year 2024–25 financial statement.
* Data for Union City Transit is unavailable, as it did not provide draft or audited financial statements for fiscal year 2024–25. The percentage change in revenue between fiscal year 2022–23 and 2023–24 was 24 percent, while the change in expenses over that period was 7 percent.
Graph 1: AC Transit’s total revenue before capital contributions increased from about $580 million in fiscal year 2022-23 to nearly $610 million in 2023-24 and just over $610 million in 2024-25 for an average annual change of +3%. Its expenditures for operations decreased from about $530 million in 2022-23 to under $510 million in 2023-24 before increasing to over $580 million in 2024-25 for an average annual change of +5%.
Graph 2:
County Connection’s total revenue before capital contributions increased from about $50 million in fiscal year 2022-23 to about $55 million in 2023-24 and nearly $60 million in 2024-25 for an average annual change of +5%. Its expenditures for operations increased from over $40 million in 2022-23 to nearly $50 million in 2023-24 then to over $50 million in 2024-25 for an average annual change of +11%.
Tri Delta Transit’s total revenue before capital contributions increased from about $35 million in fiscal year 2022-23 to about $40 million in 2023-24 before decreasing to just below $40 million in 2024-25 for an average annual change of +2%. Its expenditures for operations increased from about $31 million in 2022-23 to about $32 million in 2023-24 before decreasing to about $31 million in 2024-25 for an average annual change of +0%.
LAVTA’s total revenue before capital contributions decreased from about $27 million in fiscal year 2022-23 to about $20 million in 2023-24 before increasing to about $25 million in 2024-25 for an average annual change of -2%. Its expenditures for operations increased from just under $20 million in 2022-23 to just over $21 million in 2023-24 then to over $22 million in 2024-25 for an average annual change of +8%.
WestCAT’s total revenue before capital contributions decreased from about $16 million in fiscal year 2022-23 to about $14 million in 2023-24 before increasing to about $17 million in 2024-25 for an average annual change of +4%. Its expenditures for operations increased from about $13 million in 2022-23 to about $14 million in 2023-24 and 2024-25 for an average annual change of +6%. Union City Transit’s total revenue before capital contributions decreased from about $16 million in fiscal year 2022-23 to about $14 million in 2023-24. Its expenditures for operations increased from about $8 million in 2022-23 to about $8.5 million in 2023-24.
After the COVID-19 pandemic, the federal government passed multiple bills making additional funding available to address financial uncertainty and revenue losses. The CARES Act in 2020 provided additional grant funds for operating expenses and loss of revenue during the pandemic. The Consolidated Appropriations Act in 2021 provided funding for operations costs available beginning in December 2020 until all funds were used. Finally, the American Rescue Plan Act (ARPA) in 2021 provided operating and capital assistance beginning in January 2020 through September 2024. AC Transit, County Connection, Union City Transit, and WestCAT indicated in budget documents that they have exhausted these funds. MTC stated in a May 2025 report to Congress that emergency funds will be fully depleted by fiscal year 2026–27. Because transit agency operating costs continue to increase faster than revenue, such fiscal uncertainty may force East Bay transit agencies to consider making significant service cuts in the future.
To avoid service cuts, some transit agencies are depending on a funding measure that would support their operations, and the Legislature has provided a loan to agencies in the interim. In October 2025, the California governor approved SB 63, which will allow transit advocates to place an initiative on the November 2026 general election ballot. If approved, this initiative will impose a retail transaction tax to raise revenue for Bay Area transit agencies. In February 2026, the Governor signed and enacted Assembly Bill 117, which directs the California State Transportation Agency to provide a $590 million loan through MTC to AC Transit, BART, the San Francisco Municipal Transportation Agency, and the Peninsula Corridor Joint Powers Board, which operates Caltrain. This loan aims to help these transit agencies avoid service reductions by providing loans for operating costs. AC Transit stated in a 2026 press release that the agency will receive up to $55 million of this funding for fiscal year 2026–27.
Transit Agency Reserves
Most of the East Bay transit agencies do not have reserves in the traditional sense, but they do have a similar financial resource available. Reserves are financial resources that agencies do not include in annual spending plans and are held back in “reserve” for significant, unplanned, or unavoidable costs or revenue losses. State regulations limit the amount of state funding transit agencies receive to their actual operating costs less the sum of fare revenues and other local and federal support. None of the East Bay transit agencies have excess self-generated funds after paying for operating costs, and only AC Transit and County Connection have reserve policies that set aside reserves from budgeted or excess discretionary funds.
Instead of traditional reserves that AC Transit and other types of entities maintain in their own balance sheet accounts, five of the East Bay transit agencies rely on unallocated Transportation Development Act (TDA) funds maintained by the Alameda County auditor-controller.5 The state controller is responsible for allocating TDA funding, which comes from local sales taxes, and the Alameda County auditor-controller disburses funds to the East Bay transit agencies from its local transportation fund according to MTC’s instructions. When agencies do not use all of their allocated TDA funding, they either must return the funds to the local transportation fund or MTC could reduce their eligibility for funding in the following fiscal year by the amount they were overfunded. This is because state law limits transit agencies from receiving funds from the local transportation fund for operating costs in an amount that exceeds their actual operating costs. We found that, generally, transit agencies document any unspent TDA funds as a liability in their financial statements because they revert to the local transportation fund for allocation when needed in the future. MTC tracks these funds, which carry over from year to year, and makes these unallocated TDA balances available when requested by agencies. MTC stated it can take approximately 30 to 90 days for these funds to reach the transit agency upon request. We reviewed the annual estimates of unallocated TDA balances that MTC provides to transit agencies and found that all of the East Bay transit agencies, except AC Transit, use these funds. As a larger agency, AC Transit has decided to maintain an internal reserve fund.
We reviewed reserves and unallocated TDA balances available to each of the East Bay transit agencies and compared them with best practices and their own policies and found that all but one agency—Tri Delta Transit—had adequate reserves or balances. Each of the transit agencies and MTC refer to unallocated TDA balances as reserves and we use this term as well to describe these funds’ availability to cover expenses that traditional reserves can meet. We obtained reserve policies from each transit agency and found that three of the six agencies maintain a formal reserve policy. Union City Transit stated that it abides by the city’s reserve policy for its own funds rather than having a separate policy. Tri Delta Transit has an informal reserve goal to maintain three months of projected operating expenses. WestCAT does not have a reserve policy but tries to maintain $2 million in reserves. The Government Finance Officers Association recommends that governments have a minimum of two months of unrestricted funds available. As Figure 12 shows, five of the six agencies met this standard, as well as their own policies and goals. As a result, we determined that they have sufficient reserves in the short term.
Figure 12
Transit Agencies’ Reserves Generally Meet or Exceed Recommended Levels
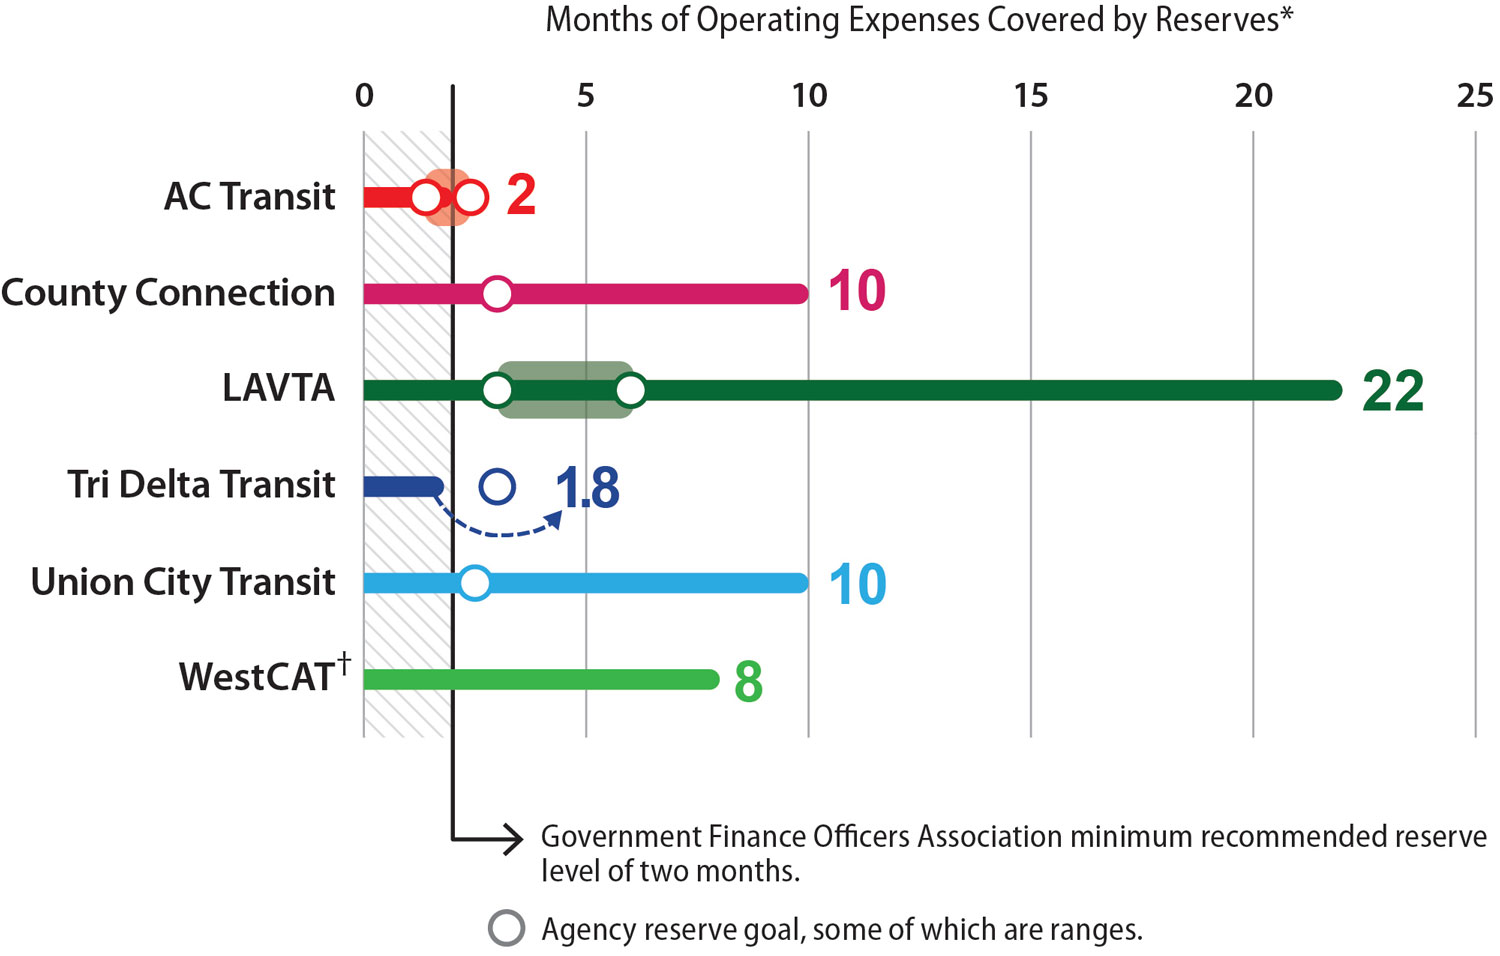
Source: Agencies’ audited financial statements and MTC fund estimates.
* Auditor identified reserve amounts for agencies other than AC Transit by reviewing their unallocated TDA balances, which the agencies consider their reserves. The balances are as of June 30, 2025, except for Union City Transit, which is based on data from fiscal year 2023–24.
† WestCAT does not have a reserve policy but aims to have $2 million available in reserves.
AC Transit has 2 months of operating expenses it can cover with its reserves, meeting the Government Finance Officers Association minimum recommended reserve level of two months. AC Transit’s reserve goal is to maintain a reserve that can cover about 1.4 months to about 2.4 months of its operating expenses. County Connection has 10 months of covered, and its goal is to maintain at least 3 months. LAVTA has 22 months of operating expenses covered by its reserves, and its goal is to maintain 3 to 6 months. Tri Delta Transit has 1.8 months covered, and its goal is to maintain at least 3 months. Union City Transit has 10 months of operating expenses covered by its reserves, and its goal is to maintain at least 2.5 months. WestCAT has 8 months of operating expenses covered by its reserves, but it does not have an agency reserve goal.
Tri Delta Transit did not have two months of reserves available, indicating financial stress. The agency noted that, in general, its reserves declined because of increased costs, decreased revenue, and its transition to zero-emission vehicles. The agency explained that increasing reserves will be challenging in the short term because the agency has no additional revenue sources other than fares and advertising. It anticipates losing funding it used to receive from BART for operating some bus routes and will need to take several actions to balance its budget, including potential service reduction. Tri Delta Transit concluded that it may also need to adjust its fares in the future.
Some agencies significantly exceed their reserve goals but recently have experienced declining reserves. For example, LAVTA had 22 months of expenditures available in its reserves, or $41 million. LAVTA’s director of finance stated that the agency is using its reserves to construct an operations facility and offices. The director of finance stated that, after construction begins, LAVTA anticipates that its reserves balance will decrease by about 50 percent. The director also stated that past experiences with sudden revenue declines, such as in 2009 during the recession, motivate the agency to have backup funds available. She noted that, prior to 2009, LAVTA did not have reserves and that it has since changed its budgeting philosophy. In the past the agency would assume that it would receive each grant for which it applied and matched its expenses to that total, but it now only budgets using revenue it is certain it will receive for that year and uses grants to allow it to build reserves. When we reviewed reserve trends from fiscal years 2022–23 through 2024–25, we found that two agencies, AC Transit and Tri Delta Transit, had reserves that grew. The remaining four East Bay transit agencies experienced moderate declines in their reserves over this period. Although all six agencies have some reserve funds available, reserves are a tool for risk management rather than managing structural imbalances between revenue and expenses.
Challenges Funding Capital Projects
East Bay transit agencies have identified challenges in funding capital expenses related to the purchase of zero-emissions buses and equipment required by state law. Transit agencies generally use federal and state grants and subsidies to finance their capital asset needs, which largely cover the cost to replace buses. The California Air Resources Board (CARB) established a requirement in state regulation that, starting on January 1, 2029, all new bus purchases by California transit agencies must be zero-emission vehicles. For context, AC Transit planned to replace 100 of its 619 vehicles in fiscal year 2025–26, and County Connection planned to replace seven of its 188 vehicles in that same fiscal year. Figure 13 shows that zero-emission vehicles can cost twice as much as traditional vehicles, leading to large financial obligations on agencies as they replace their vehicles. Costs associated with developing fueling and charging infrastructure further increase this financial burden.
Figure 13
The Cost to Convert Bus Fleets to Zero-Emission Vehicles Far Exceeds Agencies’ Available Reserves
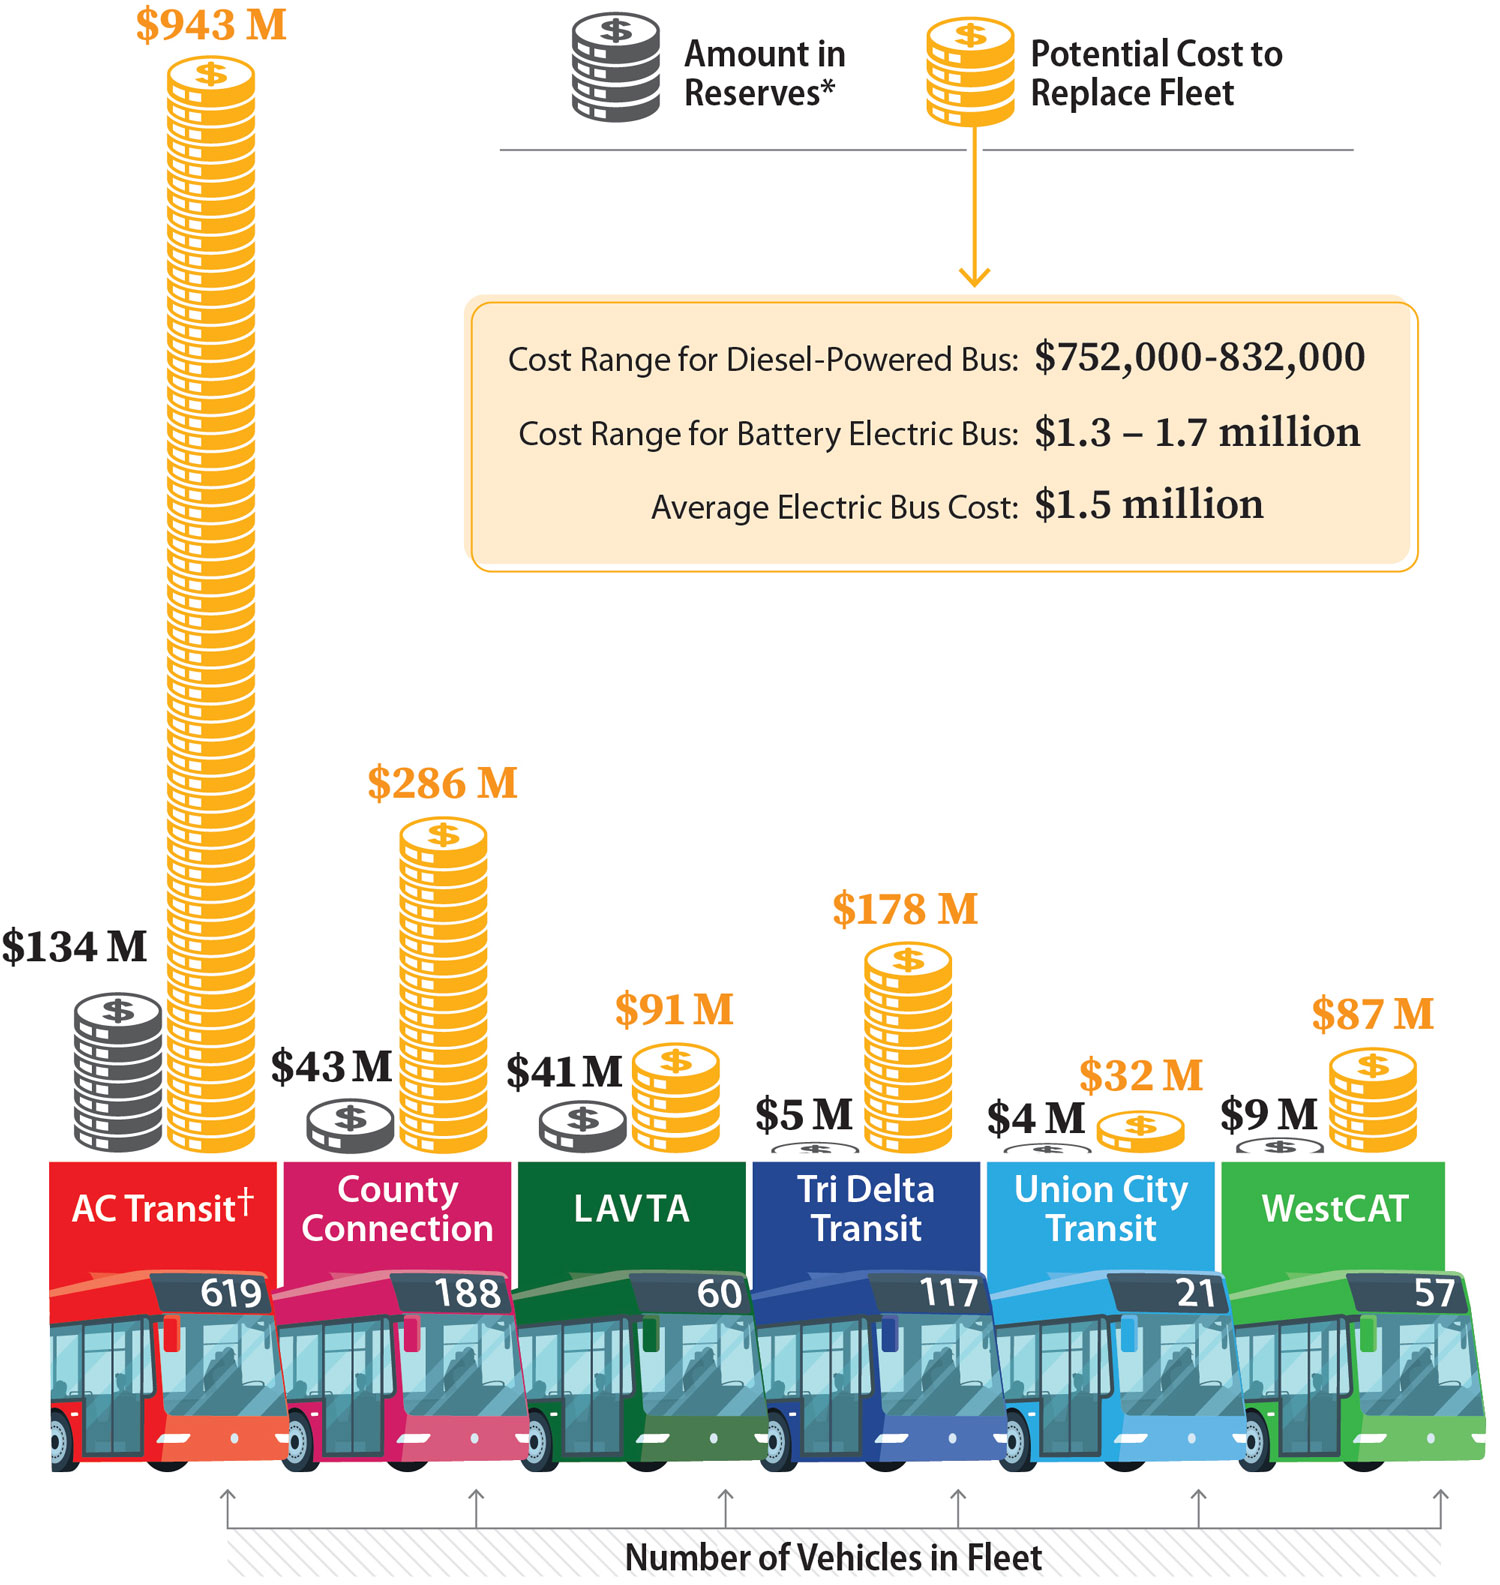
Source: MTC bus cost estimates, 2024 Federal Transit Administration profiles, agency financial statements.
Note: Potential costs assume replacement of entire fleet with battery electric buses at $1.523 million per bus and do not include costs to improve or develop related infrastructure for charging or fueling buses.
* Reserves for agencies other than AC Transit are unallocated TDA balances, which the agencies consider their reserves. Amounts are as of fiscal year 2024–25.
† $15 million of the reserve total is a capital reserve, and the remainder is an operating reserve.
The cost range for diesel powered buses is between $752,000 and $832,000. The cost range for battery electric buses is between $1.3 and $1.7 million, with an average electric bus cost of $1.5 million.
AC Transit has a reserve of $134 million and a fleet size of 619 vehicles, which would make the potential cost to replace its fleet with zero-emission vehicles $943 million.
County Connection has a reserve of $43 million and a fleet size of 188 vehicles, which would make the potential cost to replace its fleet with zero-emission vehicles $286 million.
LAVTA has a reserve of $41 million and a fleet size of 60 vehicles, which would make the potential cost to replace its fleet with zero-emission vehicles $91 million.
Tri Delta Transit has a reserve of $5 million and a fleet size of 117 vehicles, which would make the potential cost to replace its fleet with zero-emission vehicles $178 million.
Union City Transit has a reserve of $4 million and a fleet size of 21 vehicles, which would make the potential cost to replace its fleet with zero-emission vehicles $32 million.
WestCAT has a reserve of $9 million and a fleet size of 57 vehicles, which would make the potential cost to replace its fleet with zero-emission vehicles $87 million.
Each of the East Bay transit agencies we reviewed is considering seeking an exemption because of the financial burden of purchasing zero-emission buses. State regulation currently allows transit agencies to request one-year exemptions from the requirement until January 2030 under certain circumstances. For example, a transit agency may request an exemption if the available zero-emission buses cannot meet the transit agency’s daily mileage needs. All six of the agencies expressed that they are considering seeking longer exemptions, and we note that although there are funding sources that transit agencies may use to purchase zero-emission buses, such as the state Transit Intercity Rail Program or federal formula grants, they are competitive grants or are not dedicated to supporting the zero-emission transition.
Additionally, Union City Transit and WestCAT experienced changes in grants that impacted their ability to purchase previously approved zero-emission vehicles. Union City Transit’s manager stated that in August 2022, the FTA awarded grant funds to Union City Transit for the purchase of battery electric buses. In July 2025, the FTA announced that transit agencies had the opportunity to submit applications to change their projects to purchase standard vehicles. Union City Transit’s manager reported that the agency was allowed to modify its grant application from battery electric buses to compressed natural gas buses. WestCAT’s general manager stated that in July 2024, the agency received an FTA award to purchase hydrogen fuel cell buses, build its fueling station, and upgrade its maintenance facilities, but the FTA has not yet obligated, or funded, the award. The FTA did not approve any awards for hydrogen fuel cell or battery electric bus projects in fiscal year 2024–25 and has not published a statement explaining this decision.
County Connection also experienced a challenge with state grants to support its zero-emission transition. The agency’s chief financial officer stated that its congestion management agency, Contra Costa Transportation Authority, coordinated a grant application in 2022 on behalf of itself, County Connection, and LAVTA to build hydrogen fueling stations and purchase hydrogen buses for service along the Interstate 680 corridor. County Connection’s assistant general manager explained that the type of vehicle that is suited for service along this corridor is an over‑the‑road coach, which is a high-capacity vehicle designed for long-distance travel that offers amenities like reclining seats and restrooms. She noted that at the time of application for the grant, the technology was moving in the direction that this type of coach would be available in a hydrogen format. However, both she and the chief financial officer explained that, since then, the hydrogen bus market has shifted significantly, and this type of hydrogen coach does not yet exist. As a result, the financial officer stated that the award is essentially millions in grant funds that the agency cannot use. Figure 13 shows that agencies do not have the amount of funds needed to meet these zero-emission transition costs on their own.
Objective 8:
Are the Transit Agencies at Risk of Not Being Able to Operate or Expand Services in the Future?
Future Deficits and Potential to Exhaust Reserves
Five of the six East Bay transit agencies may exhaust their reserves within the next five years without new funding sources. Each of the five agencies has indicated that it will need to reduce service without additional, external sources of funding. As the text box shows, the four agencies whose budgets include projections for fiscal year 2025–26 show that they may deplete their reserves in the next few years.
Fiscal Year That Agency Budgets Expect Reserve Depletion
AC Transit: 2027–28
County Connection: 2029–30
Tri Delta Transit: 2026–27
WestCAT: 2026–27
Source: Agencies’ fiscal year 2025–26 budgets.
For agencies with projections, we compared their reserve balances to their projected budget deficits, as reported in their fiscal year 2025–26 budgets. For example, as displayed in the text box, AC Transit’s budget shows a 7 percent deficit. AC Transit used $41.5 million of its $119 million in reserves to cover this deficit. Budgeted expenditures exceeded revenues from a low of 3 percent to a high of 16 percent.
Agencies’ Deficits as a Percentage of Revenue in Fiscal Year 2025–26
AC Transit – 7%
County Connection – 16%
LAVTA – 9%
Tri Delta Transit – 10%
Union City Transit – 3%
WestCAT – 12%
Source: Agencies’ fiscal year 2025–26 adopted budgets and Union City’s fiscal year 2024–25 adopted budget.
Although two of the East Bay transit agencies—Tri Delta Transit and LAVTA—do not have budget projections, we determined they are also at risk of exhausting their reserves. Tri Delta Transit’s fiscal year 2025–26 budget does not contain projections, but we identified that it is also at risk of exhausting reserves by fiscal year 2026–27 because its fiscal year 2025–26 adopted budget shows a 10 percent deficit relative to its estimated revenue, leaving only $1.7 million remaining in reserves. We project that it will spend these reserves in fiscal year 2025–26 or fiscal year 2026–27. Tri Delta Transit’s general manager added that the operation of paratransit service, along with recent increases in fuel costs, such as diesel, contribute to Tri Delta Transit’s ongoing budget deficits. LAVTA also does not budget projections in its financial statements, but it has indicated it will likely reduce service soon without new revenue because of structural deficits.
It is unlikely that these agencies could eliminate or significantly reduce their budget deficits by increasing fares. As described in the previous section, fare revenue constitutes 10 percent or less of each agency’s total revenue, and most of the agencies would need to more than double their fare revenue to offset these deficits. For example, WestCAT collects the highest proportion of fare revenue among the six agencies and earned about $1.4 million in fares in fiscal year 2024–25. However, WestCAT projects a $1.7 million budget deficit in fiscal year 2025–26, meaning that if it chose to increase fares to offset this deficit, it would need to generate an additional $1.7 million in fare revenue on top of what it already collects. Therefore, WestCAT would need to collect a total of $3.1 million in fare revenue to eliminate this deficit, which is more than twice its current fare revenue. We find it unlikely that agencies could obtain this much revenue by simply increasing fares because if fares increase some riders may no longer choose to use public transit in favor of other transportation options.
The remaining agency, Union City Transit, does not appear to be at risk of reducing service in the medium or long term. Union City Transit had nearly $4.6 million in reserves in fiscal year 2024–25, and it projects that it will use an average of $170,000 per year from its reserves during the next three fiscal years. At this rate, Union City Transit will not exhaust its reserves for 27 years. According to the agency’s transit manager, the reason Union City Transit appears to be financially stable and is not likely to reduce service is that, as a division of the city’s public works department, Union City Transit is allowed to leverage the staff and resources of other diverse departments, leading to lower costs. The transit manager added that the agency, as a division of a larger city department, does not have significant overhead, such as rent or utility bills.
AC Transit also faces substantial risk related to its pension costs and other postemployment benefits (OPEB) that may further strain its ability to expand services in the future. As Table 5 shows, we generally identified low or moderate risks related to each agency’s pension and OPEB indicators, apart from AC Transit’s pension costs and OPEB funding. High-risk pension costs mean that the agency’s actuarially‑determined pension contributions constitute a significant portion of its revenues and will likely strain its financial resources. Similarly, AC Transit’s high‑risk OPEB funding indicates that the agency does not have sufficient assets to fund a substantial portion of these benefits. Without sufficient assets, AC Transit will likely have to make higher contributions to its OPEB plan in the future, potentially displacing other spending priorities. Combined with rising operational costs and budget deficits, these factors could lead to service reductions and limit opportunities for service expansion.
Most of the East Bay transit agencies are at risk of reducing service because of their projected financial conditions. As described above, budget deficits, the depletion of reserves, structural funding gaps, and in AC Transit’s case, high retirement obligations all contribute to the likelihood that these agencies may cut service. As the transit planning organization for the Bay Area, MTC plays a key role in coordinating state and federal transit funding by receiving and then disbursing those funds to transit agencies. Therefore, MTC may be well-positioned to identify and coordinate additional financial resources to agencies at risk of cutting vital transit services.
Objective 7:
How Much Funding Does MTC Provide and What Are the Restrictions on This Funding?
MTC’s Disbursal of Funding to Transit Agencies
MTC plays a role in multiple sources of funding for transit agencies in the East Bay. Federal transit grants, approved through the FTA, fund transit needs such as vehicle replacement. MTC uses a process to rank essential regional projects and disburses these grants to those projects. The FTA oversees compliance with federal grant requirements through triennial reviews. As discussed earlier, the state controller is responsible for allocating TDA funding, and the county auditor disburses funds according to MTC’s instructions. MTC is responsible for adopting a regional transportation plan and requires that transit agencies identify how their claims are eligible for TDA funding. For other grants such as the federal Surface Transportation Block Grant Program, the federal government is responsible for allocating such funds to the state, and the state must oversee transit agency spending of those funds. For Regional Measures 2 and 3, MTC allocates funds, and requires that transit agencies submit claims for reimbursement.6 The California State Transportation Agency is responsible for disbursing SB 125 funding to MTC, and MTC established accountability measures to govern its disbursals of those funds. MTC states that it does not have oversight or control over transit agency use of county or local tax funds.
MTC Funding Allocations
From fiscal years 2022–23 through 2024–25, MTC disbursed more than $1 billion in federal, state, and regional grants and subsidies to the selected East Bay transit agencies. We reviewed documents that MTC used to record funding allocations to the East Bay transit agencies, and we found that MTC coordinates the disbursal of at least 10 different funding sources for the region. The most significant funding sources were the Transportation Development Act (TDA), State Transit Assistance (STA), the FTA, Regional Measures 2 and 3, and SB 125. Figure 14 shows that AC Transit, County Connection, Tri Delta Transit, Union City Transit, and WestCAT experienced increases in funding between fiscal years 2022–23 and 2024–25 from these sources. As Figure 15 shows, the proportion of funds that MTC allocated for operating costs was almost always greater than the proportion of funds for capital expenses. This disbursal of funding suggests that the East Bay transit agencies are more focused on maintaining current operations than on expanding service through capital spending, which appears appropriate based on resources they have available.
Figure 14
Funds Disbursed by MTC to the Six Selected Transit Agencies We Reviewed Generally Increased Over the Past Three Fiscal Years
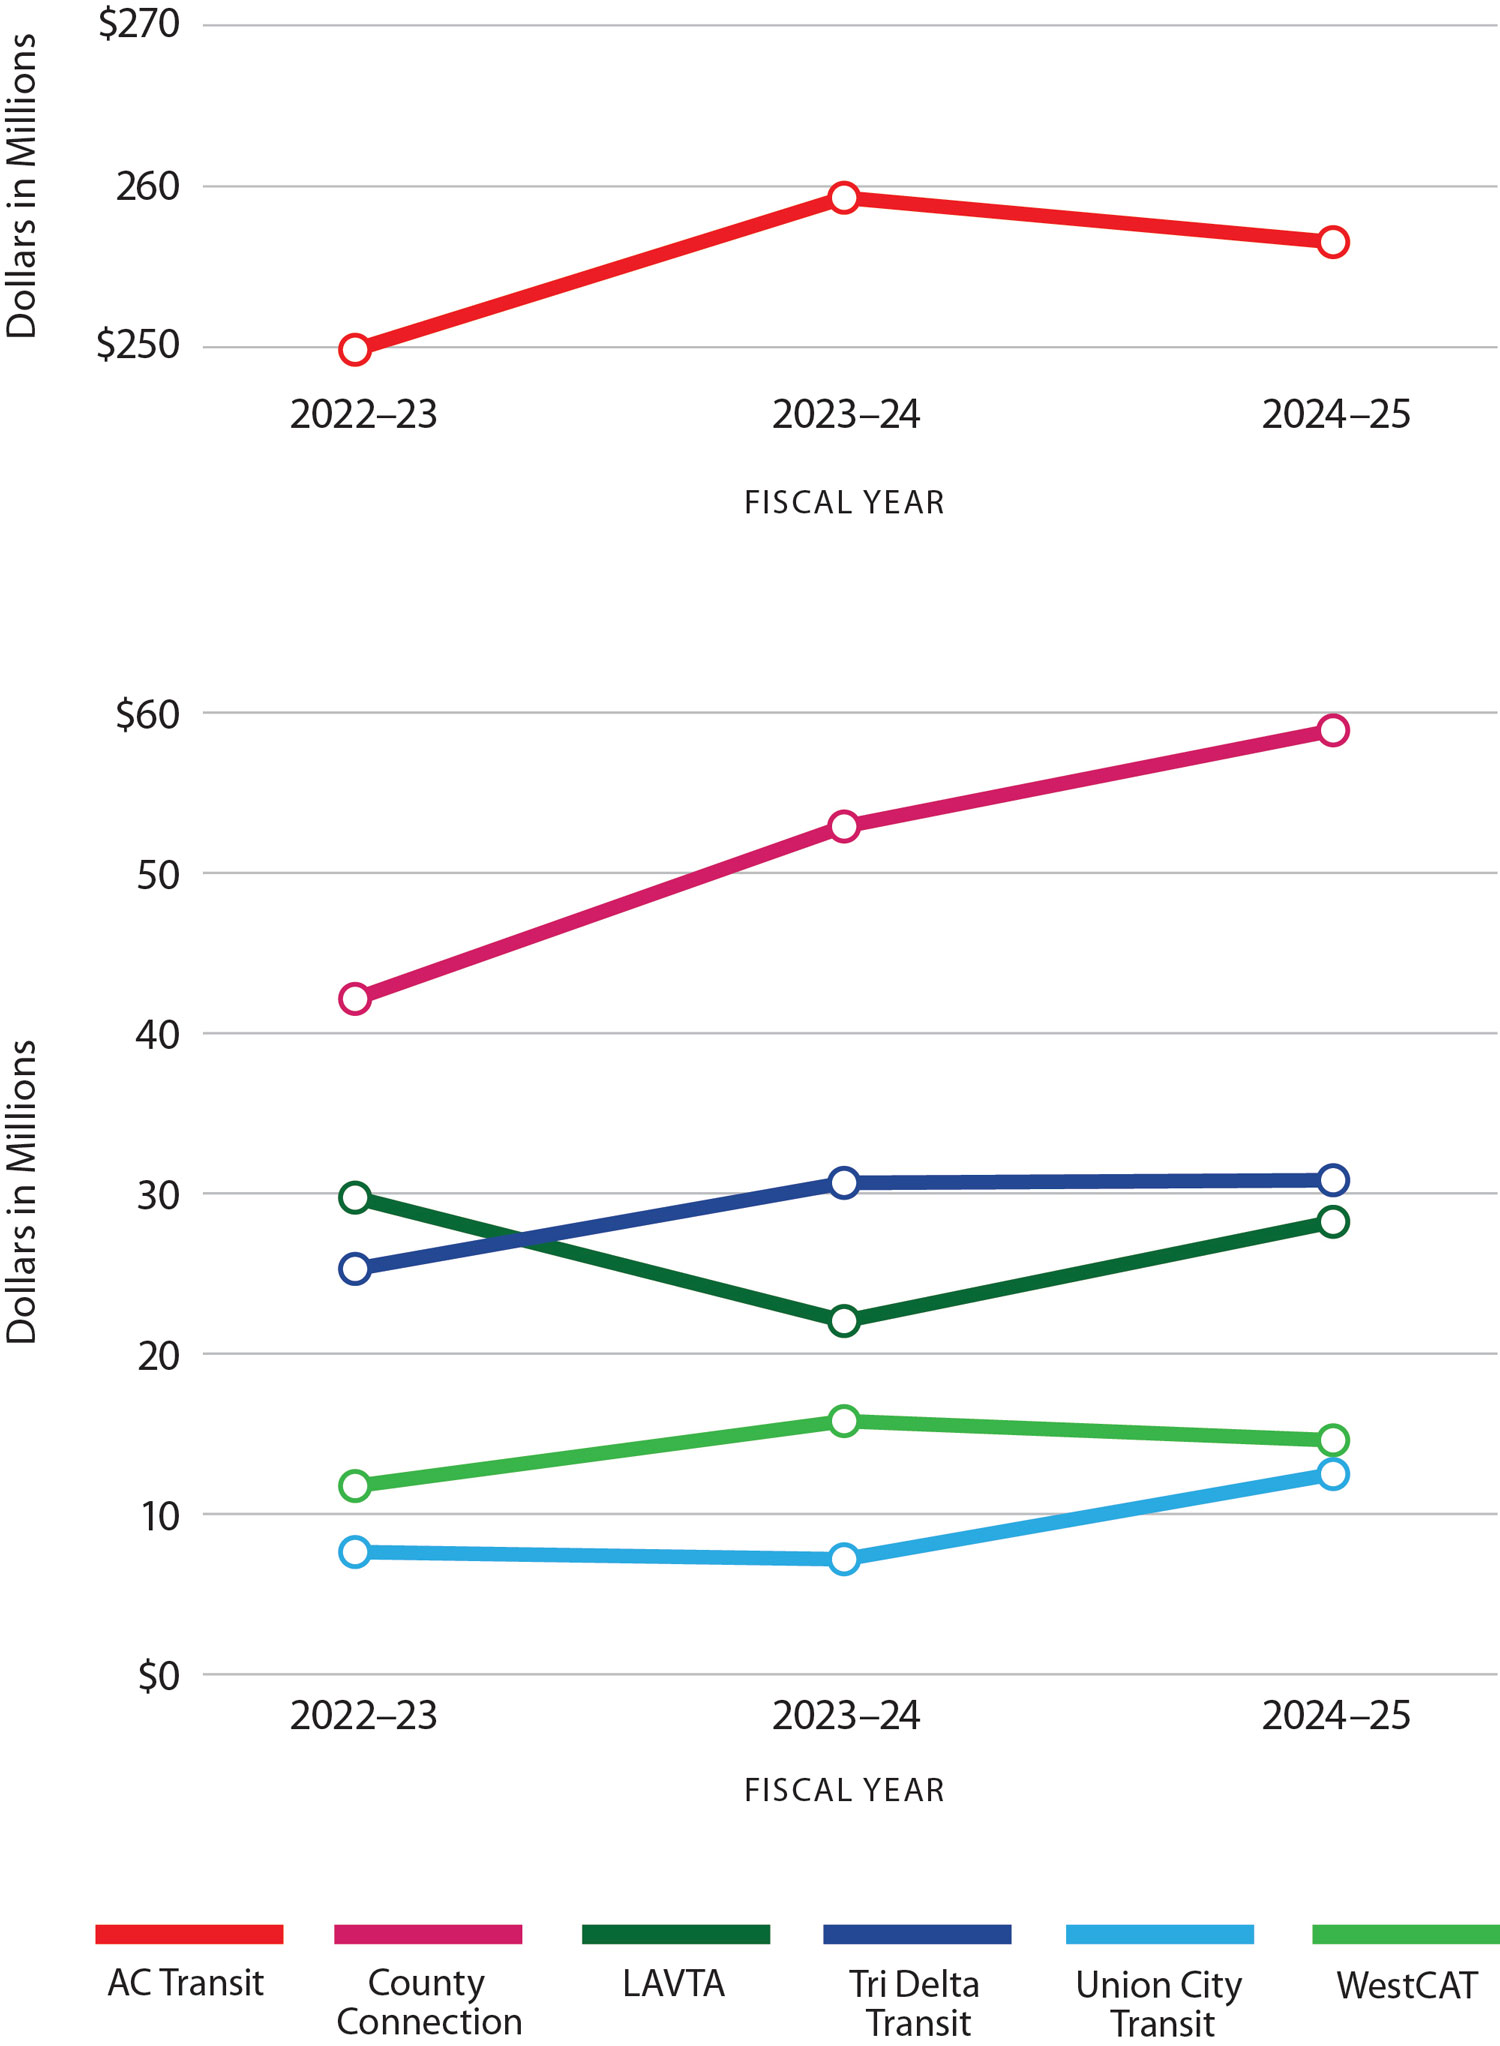
Source: MTC allocation resolutions.
MTC disbursed about $250 million to AC Transit in fiscal year 2022-23, which increased to $259 million in 2023-24 and decreased to $257 million in 2024-25. MTC disbursed about $42 million to County Connection in fiscal year 2022-23, which increased to $52 million in 2023-24 and further increased to $58 million in 2024-25. MTC disbursed about $29 million to LAVTA in fiscal year 2022-23, which decreased to $22 million in 2023-24 and increased to $28 million in 2024-25. MTC disbursed about $25 million to Tri Delta Transit in fiscal year 2022-23, which increased to $30 million in 2023-24 and 2024-25. MTC disbursed about $8 million to Union City Transit in fiscal year 2022-23, which decreased to $7 million in 2023-24 but increased to $12 million in 2024-25. MTC disbursed about $11 million to WestCAT in fiscal year 2022-23, which increased to $15 million in 2023-24 but decreased to $14 million in 2024-25.
Figure 15
Agencies Filed More Claims to MTC for Operating Costs Than for Capital Costs
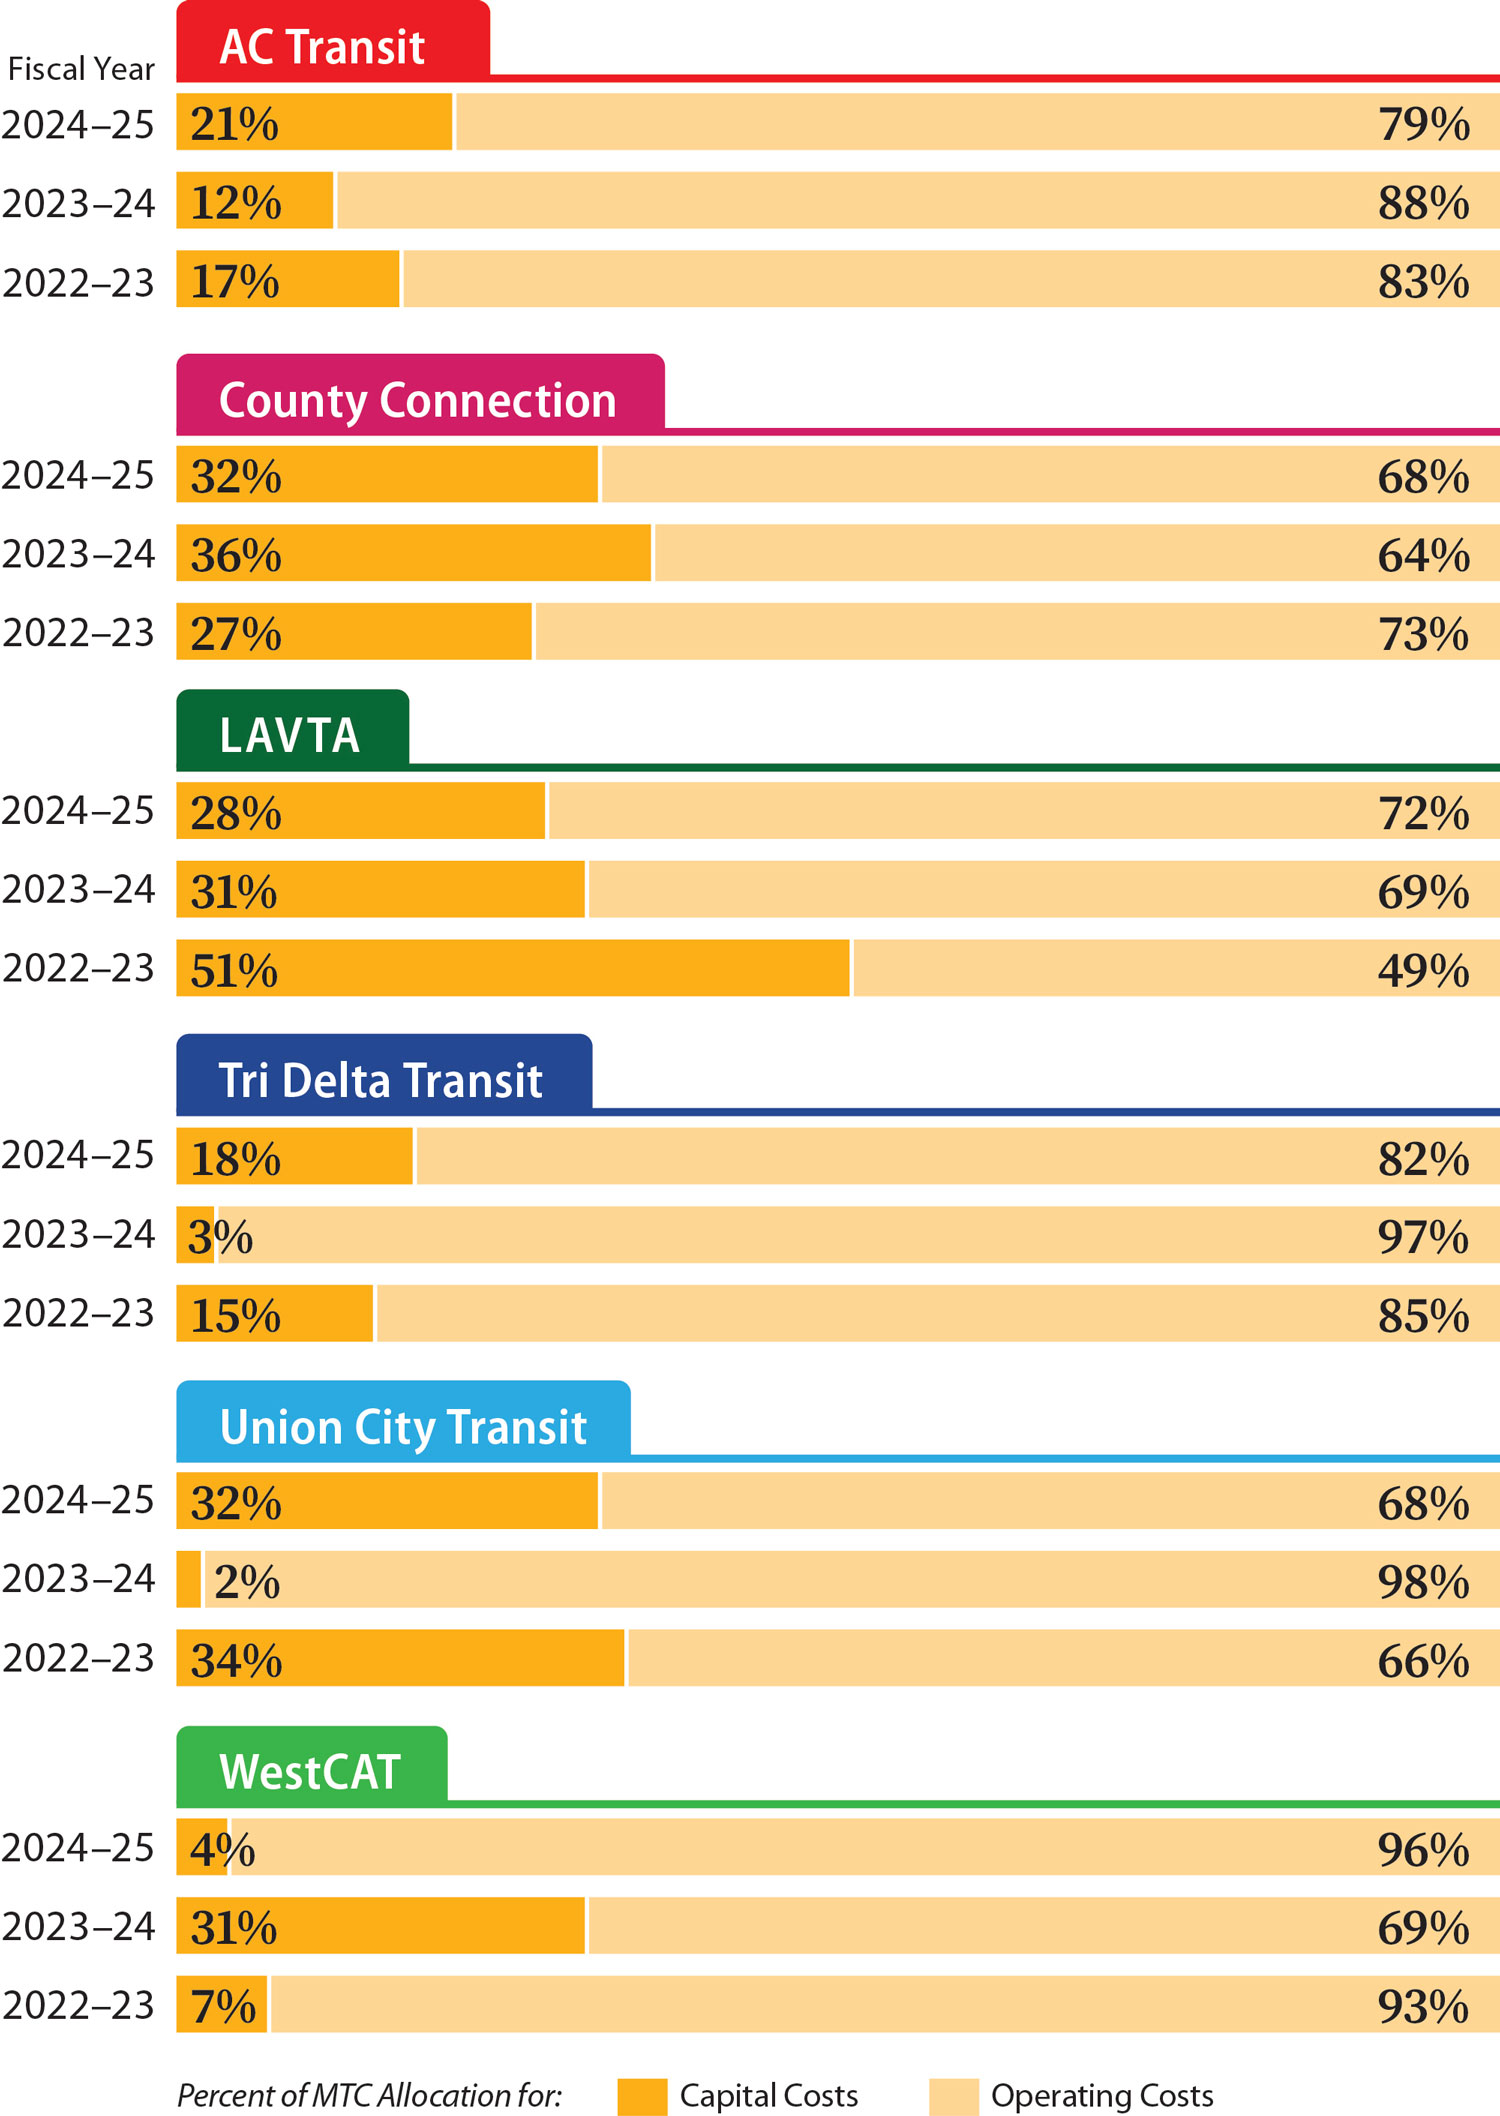
Source: MTC allocation documents.
AC Transit
2024-25: 21% capital costs and 79% operating costs
2023-24: 12% capital costs and 88% operating costs
2022-23: 17% capital costs and 83% operating costs
County Connection
2024-25: 32% capital costs and 68% operating costs
2023-24: 36% capital costs and 64% operating costs
2022-23: 27% capital costs and 73% operating costs
LAVTA
2024-25: 28% capital costs and 72% operating costs
2023-24: 31% capital costs and 69% operating costs
2022-23: 51% capital costs and 49% operating costs
Tri Delta Transit
2024-25: 18% capital costs and 82% operating costs
2023-24: 3% capital costs and 97% operating costs
2022-23: 15% capital costs and 85% operating costs
Union City Transit
2024-25: 32% capital costs and 68% operating costs
2023-24: 2% capital costs and 98% operating costs
2022-23: 34% capital costs and 66% operating costs
WestCAT
2024-25: 4% capital costs and 96% operating costs
2023-24: 31% capital costs and 69% operating costs
2022-23: 7% capital costs and 93% operating costs
Funding Restrictions
We reviewed the funding restrictions associated with FTA grants and funds from TDA, STA, Regional Measures 2 and 3, and SB 125, and found that each funding source has various restrictions on how transit agencies may spend those funds and place obligations on recipients. For example, Regional Measure 3 funds may only be spent on transit projects that improve transit and reduce congestion along certain Bay Area transportation corridors. Recipients must also meet performance measures established by MTC, such as providing reliable, on-time service. TDA funds are more flexible, and may be used to support public transportation systems, community transit services, and other costs. The text box provides some examples of funding restrictions, and Table A3 in Appendix A provides a summary of the restrictions for all funding sources we identified.
Examples of Funding Restrictions
Transit agencies must use certain funds either for operating costs or capital expenses.
Federal grants usually cover 80 percent of costs and require transit agencies to cover the remaining 20 percent.
Transit agencies must meet efficiency standards to receive certain funds.
Source: Federal and state law and MTC policies.
In regards to the disbursement procedure, MTC follows a process to authorize key funding to transit agencies. First, MTC provides transit agencies with an annual estimate of available funds. It then instructs transit agencies to submit claims that document funding eligibility. Finally, MTC either authorizes disbursement of the funds, or instructs county controllers to disburse the funds.
Feasibility of Merging Transit Agencies
Key Points
- We combined the financial statements of the East Bay transit agencies in Alameda County and those in Contra Costa County to assist in determining the likely financial condition of a single bus transit agency in each of these two counties. However, because the existing transit agencies exhibited poor financial conditions, we concluded that the hypothetical combined agencies would likewise be in an unfavorable financial position. Specifically, these agencies would have significant negative unrestricted net positions, meaning they would not be able to expand service or be financially healthy.
- Merging East Bay transit agencies may result in an increase in operating costs, primarily because of the need to standardize wages and benefits across the merged agencies with the significantly higher costs of AC Transit. Other significant legal and practical impediments also limit the feasibility of a merger of East Bay transit agencies, such as federal laws around collective bargaining rights and the potential decline in service quality resulting from a loss of local control in the areas that are not within AC Transit’s current service area.
Objectives 9 & 10:
Would Merging Transit Agencies Be Feasible, Solve Financial Challenges, and Provide Benefits to Riders?
Financial Conditions of Potentially Merged East Bay Transit Agencies
We combined the financial statements of the East Bay transit agencies in Alameda County and those in Contra Costa County to assist in determining the likely financial condition of a single bus agency in each of these two counties. Specifically, we combined information about total assets, total liabilities, net position, operating revenues, operating expenses, and nonoperating revenue and expenses, which are defined in the text box. We also split AC Transit’s financial information between these two counties because it operates in both. County Connection, Tri Delta Transit, and WestCAT are in Contra Costa County, and about 10 percent of AC Transit’s ridership is in that county. Meanwhile, Alameda County contains LAVTA, Union City Transit, and about 90 percent of AC Transit’s ridership. As a result, we split AC Transit’s financial information between the two hypothetical county-based bus agencies and present our summations in Table 6. We performed this analysis for fiscal years 2023–24 and 2024–25 so that we could identify financial trends for the two hypothetical agencies and provide this more detailed information in Table B.1 in Appendix B.
Definitions of Financial Terms
Total Assets: Resources with present service capacity that the government currently controls, such as cash, buses, and buildings.
Total Liabilities: Present obligations to sacrifice resources that the government has little or no discretion to avoid, such as accounts payable and lease obligations.
Net Position: The difference between assets and liabilities, resources available for future operations.
Operating Revenues: Revenue generated from the day-to-day operations of the entity.
Operating Expenses: The costs associated with providing services and running the entity.
Nonoperating Revenue and Expenses: Revenue and expenses generated by things that are not directly related with the services the entity offers, such as investment income or external subsidies.
Source: Government Accounting Standards Board documents.
The financial information we aggregated indicates that combining these agencies may not provide significant financial benefits because of negative unrestricted net positions. We evaluated the impact this combination would have on unrestricted net position because it represents the financial flexibility to manage day-to-day operations, handle unexpected financial crises, and fund capital improvements without external support. All six agencies have a negative unrestricted net position, and for two agencies, including AC Transit, this is a substantial amount.7 Ultimately, this net position is intended to serve as a measure of the financial resources available. When we combined the financial information of the transit agencies to simulate two agencies, one for Alameda County and one for Contra Costa County, both of the agencies would continue to have negative unrestricted net positions. Having a negative unrestricted net position means that the agencies—individually or combined—have limited resources for future operations or expansion of services.
One of the main reasons that combining these agencies would not significantly improve its financial situation comes from the merging of long-term liabilities related to pension and OPEB benefits. Although not all six agencies provide these benefits, the long-term liabilities of AC Transit alone exceed the total assets of all other agencies. Further, these obligations are likely to increase in the combined agencies because more employees would be eligible for such benefits, as we discuss later. Another limitation on the agencies’ financial condition is that their capital assets constitute a significant portion of their overall assets. These capital assets are generally buses and buildings, and therefore agencies cannot quickly convert them into cash to cover immediate, short-term expenses. Because these agencies would not be healthier financially under the combinations outlined above, we attempted to determine whether an even larger agency would have a better financial condition.
When we combined the financial statements to include all six East Bay transit agencies, we found similar concerns. Specifically, this hypothetical agency would also have a large negative unrestricted net position, as shown in Table B.2 in Appendix B. Additionally, the single agency does not show a significant change in this unrestricted net position year over year. Moreover, small increases in revenues would be overcome by large increases in expenses and increasing operating losses. As a result, this agency’s net position would likely decline further over time. Finally, the estimated expenditures we used in our analysis would increase significantly following a merger. We discuss at greater length below that combining the East Bay transit agencies would require significant increases in labor expenses because of protections for represented workers. As a result, we do not estimate that one or two hypothetical bus transit agencies serving the East Bay, created through the combination of existing agencies, would result in financially stronger transit agencies.
Costs and Benefits of Merging Transit Agencies
Although there are some potential fiscal benefits to merging transit agencies, achieving such benefits in practice in the East Bay may be challenging. We searched for reviews, analyses, reports, and studies related to transit agency mergers or consolidation and asked for any studies MTC or the transit agencies had available. We identified 10 past studies on the feasibility of merging bus service agencies in the Bay Area conducted by the University of California Institute of Transportation Studies, consultancy groups, MTC, and the Solano Transportation Authority between 1987 and 2020. However, only two of these 10 studies recommend that bus agencies merge, and none of the remaining studies recommended merging to improve the overall financial condition of the relevant agencies. We identified two areas of potential cost savings from these studies: consolidating administrative functions and reducing duplicative routes. However, we found major impediments to achieving cost savings in both areas.
Our review identified that these potential cost savings would be minimal for the hypothetical county-based bus agencies. For example, one study noted that savings achieved by consolidating administrative staff could be undone by the need for a substantial management structure to administer a large and geographically dispersed agency, and that administrative staff are not large in transit agencies, limiting potential savings. The text box provides administration costs as a percentage of total operating costs for the agencies that we reviewed, which range from 3 percent to 35 percent of agency spending. We describe below that labor costs would likely increase significantly following a merger, which would likely eclipse administrative savings. Finally, both past studies and our own analysis related to Objective 3 have not identified significant levels of duplicative bus service among East Bay transit agencies. As such, it is unlikely that merging East Bay transit agencies would produce significant savings.
Administrative Costs as Share of Operating Expenses Vary Significantly
AC Transit – 28%
County Connection – 25%
LAVTA – 35%
Tri Delta Transit – 23%
Union City Transit – 3%
WestCAT – 17%
Source: National Transit Database data and Union City financial statements.
In fact, standardizing wages and benefits following a merger could increase overall labor costs because AC Transit has significantly higher labor costs than do the other agencies. As Figure 16 illustrates, although wages are only a bit higher at AC Transit compared to the other agencies, AC Transit’s overall compensation package for bus drivers is significantly higher than the other agencies, mostly because of its retirement benefits. County Connection, which, like AC Transit, employs drivers directly, would have to increase driver compensation by approximately 28 percent to match AC Transit’s spending. The remaining agencies, whose drivers are contractors, not employees, would need to increase total driver compensation by 58 percent to 78 percent to match AC Transit’s compensation package for drivers. To standardize salary and benefits in the event of a merger, the new agencies would either have to obtain substantial concessions from current AC Transit drivers, such as agreeing to reductions in compensation and benefits, or greatly improve the compensation for drivers working in the areas currently served by the other agencies.
Figure 16
The Costs to Compensate Bus Drivers Are Significantly Higher at AC Transit Than Other Agencies, Primarily Because of Retirement Benefits
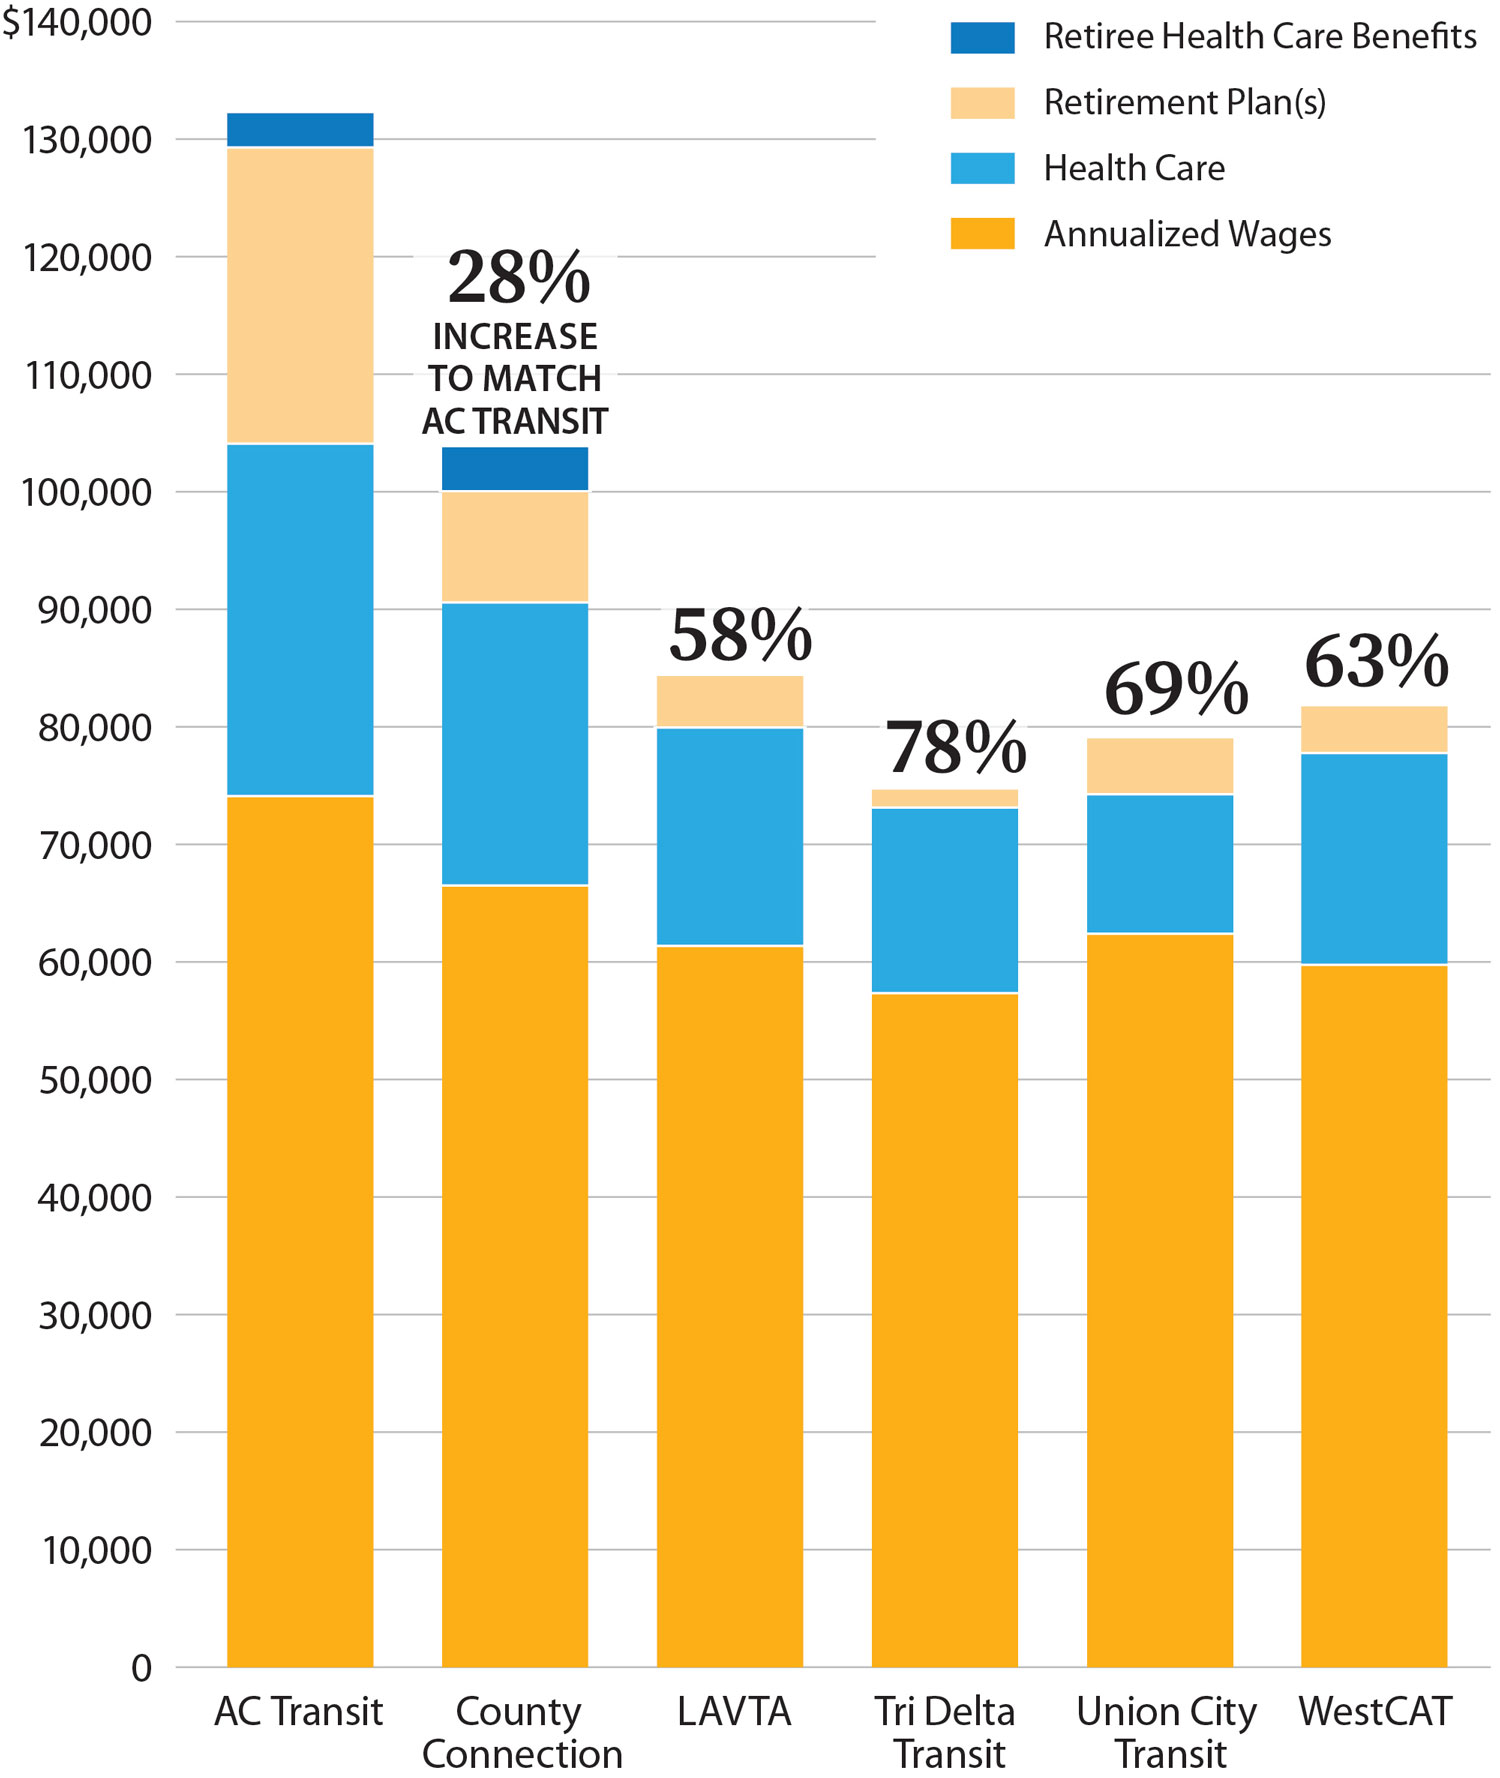
Source: Agencies’ union agreements.
Note: Calculations assume a bus driver with three years of experience, receiving health care coverage for themselves and a spouse or dependent.
The total compensation for bus drivers is comprised of retiree health care benefits, retirement plans, health care, and annualized wages. AC Transit’s total compensation for a driver is over $130,000, with significant retirement and health care costs and the majority of the amount for wages. County Connection’s total compensation for a driver is over $100,000, with a similar cost for health care but a significantly lower cost for retirement benefits. County Connection would need to increase its total compensation by 28% to match AC Transit. LAVTA’s total compensation for a driver is about $85,000, with lower costs for health care and retirement benefits and no retiree health care benefits. LAVTA would need to increase its total compensation by 58% to match AC Transit. Tri Delta Transit’s total compensation for a driver is about $75,000, with lower costs for health care and retirement benefits and no retiree health care benefits. Tri Delta Transit would need to increase its total compensation by 78% to match AC Transit. Union City Transit’s total compensation for a driver is about $80,000, with lower costs for health care and retirement benefits and no retiree health care benefits. Union City Transit would need to increase its total compensation by 69% to match AC Transit. WestCAT’s total compensation for a driver is a little over $80,000, with lower costs for health care and retirement benefits and no retiree health care benefits. WestCAT would need to increase its total compensation by 63% to match AC Transit.
Even if the new agencies were able to obtain major concessions from current AC Transit employees following the merger, doing so could risk the loss of certain federal funds. Federal law requires, as a condition for providing financial assistance to transit operators, that all employees who are affected by the receipt of federal funds be protected under arrangements that are fair and equitable. Following a transit agency being acquired to create a new agency, federal law requires continuation of collective bargaining rights, the protection of employees from a worsening of their positions, and assurance that employees would be employed by the new agency. If the secretary of labor determines that interests of employees are not protected, such as if the creation of new transit agencies to serve Contra Costa County and Alameda County resulted in labor agreements that were not deemed fair and equitable, the new agencies might not be eligible for federal assistance.
Legal and Contractual Impediments to Merging Transit Agencies
The varied dissolution processes for the existing agencies are significant obstacles to a merger. Under state law, AC Transit may only dissolve if it no longer operates any transit facilities, at which point its dissolution would still require approval from both its board and from voters. Dissolution of AC Transit would result in the loss of special tax revenue that currently provides funding for bus service in the East Bay. AC Transit was authorized, with voter approval, to create special transit districts and to impose special taxes to support transit in Alameda and Contra Costa counties. AC Transit created Special Transit Service District 1, which straddles Alameda and Contra Costa counties, and voters approved a parcel tax that generates more than $30 million in annual revenue for AC Transit. This revenue would not transfer to newly created transit agencies unless the Legislature provided taxing authority to the new entities and local voters approved new special taxes. However, this loss of revenue might be avoided by merging the East Bay transit agencies into one bus agency because the special transit district would remain intact. For the four agencies organized as JPAs, dissolution would require the support of one or more of their member jurisdictions—including the cities listed in the text box—or action by the Legislature. For Union City Transit to be annexed into a transit district, state law would require the city council to support the annexation, or voters would have to carry out a petitioning process. Given the number of entities involved in the dissolution processes, as a practical matter, the formation of a new merged transit agency would likely not be possible without the Legislature passing a law to authorize the formation of the new agencies and the dissolution of their predecessors.
JPA Member Entities
County Connection: Contra Costa County, Concord, Clayton, Danville, Lafayette, Martinez, Moraga, Orinda, Pleasant Hill, San Ramon, Walnut Creek
Tri Delta: Contra Costa County, Antioch, Brentwood, Oakley, Pittsburg
WestCAT: Contra Costa County, Hercules, Pinole
LAVTA: Alameda County, Dublin, Livermore, Pleasanton
Source: Agency websites and JPA agreements.
The legal protections afforded to contractors also could complicate or add to the cost of pursuing a merger. Two of the six agencies, LAVTA and County Connection, have provisions in their JPA agreements preventing dissolution from occurring when the JPA has executed long-term contracts for public transportation services. As of May 2026, LAVTA has a long-term contract for public transportation services, but County Connection confirmed that it does not. Further, to avoid potential legal challenges, any legislation that combines transit agencies would have to address the rights of any private contractors and the contractual obligations owed to them. Four of the six agencies contract bus operations to a private firm. Because of the legal protections for contractors, if the Legislature chose to pursue new transit agencies for Alameda and Contra Costa counties, it would need to address claims resulting from these contracts.
Additionally, there are a variety of retirement plans in place across the six agencies with varying benefits, which could complicate the creation of new East Bay transit agencies. Employees at County Connection, LAVTA, Union City Transit, and WestCAT are eligible for pensions administered by CalPERS. State law prohibits a JPA with CalPERS obligations from dissolving until it has apportioned pension liabilities among the parties. If the Legislature does not establish a plan for any successor transit agency to absorb these liabilities, the member entities of the JPA would bear that responsibility. AC Transit employees belong to the AC Transit Employees Retirement Plan, an independent public pension plan that is not administered by CalPERS. AC Transit does not currently have an agreement with CalPERS to allow employees with service credit in one system to transfer to the other without receiving reduced retirement benefits. The two systems also have different employee and employer contribution rates, vesting periods for active members, and pension benefit formulas for their two tiers of employees. In 2002, when the Legislature consolidated transit boards in San Diego County, it passed legislation to preserve the employment and pension rights of existing employees. If the Legislature chooses to pursue mergers of East Bay transit agencies, it may be necessary to include similar provisions to clarify how the new agencies would manage the retirement benefits of existing employees in a fair and equitable way.
Potential Changes to Service Quality
Creating two new transit agencies that provide bus services to Alameda and Contra Costa counties may not necessarily improve the transit connectivity among communities in the same county and could even negatively affect the quality of service for some riders. Several of AC Transit’s routes transport riders between Contra Costa County and Alameda County, including the popular 72, 72L, and 72M bus lines that connect Richmond, San Pablo, and El Cerrito in Contra Costa County with Oakland, Berkeley, Emeryville, and Albany in Alameda County. These routes link some disadvantaged communities directly with job centers. Creating transit agencies by county could inconvenience these riders. For example, riders might need to transfer between the systems, lengthening their commutes, or change to another service provider such as BART. Moreover, although Union City Transit and WestCAT both overlap with AC Transit’s service area, the remaining three agencies are separated from the other East Bay transit agencies by mountains, limiting the practicality of buses as a means of connecting these service areas in the event of a merger. Forming a transit agency for bus service in Contra Costa County could break up existing routes that provide connectivity with Alameda County, without necessarily facilitating greater connection between the different subregions of Contra Costa County across the mountains that separate service areas. Similar to the issue of AC Transit’s special tax district, merging the existing East Bay transit agencies into one bus agency for the two counties could instead maintain direct service in this area.
A final consideration is the potential decline in service quality that could result from the loss of local control by the cities outside of AC Transit’s service area. Management at several of the East Bay transit agencies have told us that local control benefits riders. Specifically, WestCAT and Union City Transit noted that residents have more of a voice in the provision of bus services in their communities than would be the case if they were a smaller component of a larger agency. The executive director of LAVTA also cited the presence of direct oversight by local elected officials as a benefit to riders in their service area and further suggested that local control keeps costs down and ensures that taxes that are raised locally are also spent locally. Similarly, County Connection and Tri Delta Transit suggested that the smaller scale of their agencies allows staff to have a more informed understanding of local needs compared to a hypothetical, larger agency headquartered further away from their suburban areas. Management at County Connection, LAVTA, and WestCAT further noted that, historically, when AC Transit was responsible for bus service in the outer suburbs, it provided minimal service to these areas. AC Transit management, for their part, told us that if they were to merge with the other agencies, they anticipate that the different operating environments and long distances across the new service area could negatively affect the reliability of service.
Recommendations
Legislature
To ensure that agencies can comply with CARB’s mandate to make all new bus purchases zero-emission starting in 2029, the Legislature should consider extending this deadline or allocating new funds to the transit agencies to purchase zero‑emission buses.
MTC
- To improve its effectiveness in managing regionwide projects and mitigate the risk of missing target completion dates for action items, MTC should immediately establish realistic and attainable time frames for each item by setting major milestones and subtasks, along with identifying potential risks and mitigation strategies for delays caused by interdependent activities.
- To guide its decisionmaking and better measure progress toward completing items in its transit action plan, MTC should, as part of its ongoing effort to analyze the regional network management framework’s progress, build upon the adopted May 2024 performance metrics to include achievable outcomes, such as the increase in new riders on existing routes. MTC should define linkages between these adopted metrics and outcomes when it updates the transit action plan.
- To address the risk that transit agencies may have to reduce services due to rising operational costs, MTC should by January 2027 further identify funding sources, such as federal, state, or locally-generated revenue, that could be obtained and directed to transit agencies at risk of reducing services, such as AC Transit, County Connection, Tri Delta Transit, and WestCAT. MTC should also work with transit agencies to identify operational cost savings.
We conducted this performance audit in accordance with generally accepted government auditing standards and under the authority vested in the California State Auditor by Government Code section 8543 et seq. Those standards require that we plan and perform the audit to obtain sufficient, appropriate evidence to provide a reasonable basis for our findings and conclusions based on the audit objectives. We believe that the evidence obtained provides a reasonable basis for our findings and conclusions based on our audit objectives.
Respectfully submitted,
GRANT PARKS
California State Auditor
May 28, 2026
Staff:
Jim Adams, MPP, Audit Principal
Nicole Madera, MPP, Senior Auditor
Alyssa Centeno
Miles Culpepper, PhD
Taylor Gray, PhD
Amanda Ozaki-Laughon, MPP
Cesar Rodriguez
Legal Counsel:
Ethan Turner
Appendices
Appendix A
MTC Funding Coordination From Fiscal Years 2022–23 Through 2024–25
The Audit Committee requested that we determine for each selected agency the amount of funding MTC provides. To accomplish this, we reviewed MTC allocation resolutions and grant awards to the six selected East Bay transit agencies over the three most recent fiscal years. We found that over the last three fiscal years, MTC coordinated the disbursal of approximately $1.15 billion to the six transit agencies. Table A.1 summarizes each of the federal, state, and regional funding sources and the aggregate total allocated to the selected agencies between fiscal years 2022–23 and 2024–25. Table A.2 provides the totals for each agency. Table A.3 provides a high-level summary of funding restrictions.
Appendix B
Financial Information for Hypothetical Bus Transit Agencies
The Audit Committee directed us to determine the likely financial condition of a single transit agency for local bus service serving Contra Costa County and a single transit agency for local bus service serving Alameda County if such agencies comprised the combined agencies currently operating in each county. In tables B.1 and B.2, we identify the potential financial information of three types of bus transit agencies. Table B.1 shows how we made our estimates by summing the financial information of transit agencies in each of the two counties, as well as trends in that information over two fiscal years. Table B.2 shows the same information for a single bus transit agency across the two counties.
Appendix C
Scope and Methodology
The Audit Committee directed the California State Auditor to conduct an audit related to administrative oversight of selected East Bay transit agencies. Table C lists the objectives that the Audit Committee approved and the methods we used to address them. Unless otherwise stated in the table or elsewhere in the report, statements and conclusions about items selected for review should not be projected to the population.
Response to the Audit
Metropolitan Transportation Commission
May 1, 2026
Mr. Grant Parks
California State Auditor
621 Capitol Mall, Suite 1200
Sacramento, CA 95814
RE: Audit of East Bay Transit Agencies & MTC
Dear Mr. Parks,
Thank you for the opportunity to respond to the California State Auditor’s Report No. 2025-120. Below please find our response to the recommendations pertaining to MTC.
Recommendation 1: To improve its effectiveness in managing regionwide projects and mitigate the risk of missing target completion dates for action items, MTC should immediately establish realistic and attainable time frames for each item by setting major milestones and subtasks, along with identifying potential risks and mitigation strategies for delays caused by interdependent activities.
MTC Response: MTC convened the Blue Ribbon Transit Recovery Task Force at the height of the COVID pandemic as a voluntary effort that culminated in the Transit Transformation Action Plan (Action Plan) to improve the Bay Area’s public transportation network. The Task Force recommended the establishment of ambitious dates to accelerate progress to create a more user-friendly and connected system. MTC is implementing the Action Plan in coordination with the region’s 27 transit operators. MTC also formalized a Regional Network Management structure to support and guide the Action Plan implementation. The Regional Network Management structure relies on collaboration and partnership as each of the transit operators are independent agencies with their own staff and governing boards. We agree with the goal of enhanced transparency on project delivery timelines.
Recommendation 2: To guide its decision‑making and better measure progress toward completing items in its transit action plan, MTC should, as part of its ongoing effort to analyze the regional network management framework’s progress, build upon the adopted May 2024 performance metrics to include achievable outcomes, such as the increase in new riders on existing routes. MTC should define linkages between these adopted metrics and outcomes when it updates the transit action plan.
MTC Response: We agree. The mission of Regional Network Management is to drive improvements in the customer experience for Bay Area transit. We will use the adopted performance metrics to measure and track outcomes.
Recommendation 3: To address the risk that transit agencies may have to reduce services due to rising operational costs, MTC should by January 2027 further identify funding sources, such as federal, state or locally-generated revenue, that could be obtained and directed to transit agencies at risk of reducing services, such as AC Transit, County Connection, Tri Delta Transit, and WestCAT. MTC should also work with transit agencies to identify operational cost savings where possible.
MTC Response: Since the pandemic, MTC has advocated at the state and federal levels for over $5 billion in new revenue to assist Bay Area transit agencies with their financial challenges. Last year, MTC successfully advocated for the passage of SB 63 (Wiener/Arreguin) in 2025 which authorizes a 14-year regional transit measure to be placed on the November 2026 ballot to provide new transit operations funding. MTC will continue to advocate that the State of California increase financial support for public transit given its importance to the state’s goals and the Bay Area’s economy, environment, affordability and quality of life.
Sincerely,
Sue Noack, MTC Chair
Footnotes
- MTC stated that it has written letters to transit agencies related to coordination compliance, but agencies ultimately complied with MTC’s requirements, and it determined no sanctions were needed. ↩︎
- The Clipper system is a reloadable fare payment system for public transportation across the San Francisco Bay Area. It works on all major bus, rail, and ferry services, such as BART, Muni, Caltrain, and AC Transit, and can be used as a physical card or via a mobile app. ↩︎
- SB 125 provided $1.1 billion in one-time multiyear bridge funding to Bay Area transit agencies for operating support or capital projects. ↩︎
- Tri Delta Transit experienced an increase of 0.3 percent and, although Union City Transit did not have audited fiscal year 2024–25 information available, it experienced a 7 percent increase in expenses in prior years. ↩︎
- The TDA allows each county to establish a local transportation fund that receives revenue from certain sales and use taxes to support public transportation systems. ↩︎
- Regional Measures 2 and 3 are voter-approved increases to Bay Area bridge tolls to fund specific highway and transit projects. Regional Measure 2 projects support better connections between BART, buses, ferries, and rail, whereas Regional Measure 3 projects support transit improvements to the transbay corridor and AC Transit rapid bus improvements. ↩︎
- Net position consists of three components: net investment in capital assets, restricted, and unrestricted. Net investment in capital assets represents capital assets, such as land, buildings and equipment, minus accumulated depreciation and outstanding debt related to acquiring or improving those assets. The restricted component of net position consists of resources with constraints placed on their use by external parties, such as creditors, grantors, and legal obligations, whereas the unrestricted component is the residual amount of net position, not included in the other two categories, that is available for general operations. ↩︎