2023-124 Local Streets and Roads Program
State Agencies and Cities Are Generally Following Requirements as They Attempt to Improve Conditions
Published: April 4, 2024Report Number: 2023-124
April 4, 2024
2023-124
The Governor of California
President pro Tempore of the Senate
Speaker of the Assembly
State Capitol
Sacramento, California 95814
Dear Governor and Legislative Leaders:
As directed by the Joint Legislative Audit Committee, my office conducted an audit of the Local Streets and Roads Program (program). Our assessment focused on the California Transportation Commission’s (Commission) and the State Controller’s Office’s (State Controller) administration of the program and the manner in which six selected cities have used program funds. In general, we determined that state agencies are appropriately allocating program funds to cities and counties, and the selected cities are properly using funds to improve local streets. Nevertheless, street conditions are continuing to decline, and the State Controller has not held cities to some key aspects of accountability for their required local streets and roads spending.
We found that the Commission has properly determined funding eligibility for all cities and counties in the State and that the State Controller distributed funds according to state law. The Commission also ensured that all cities and counties reported their expenditures of program funds, and it provided that information to the public on its website. The six cities we reviewed appropriately used program funds to maintain and repair streets and on other allowed activities, including street safety projects. Nevertheless, and despite the significant additional funding that the program provides, pavement conditions in the cities we reviewed are generally declining.
We found that the State Controller is not ensuring that cities and counties follow a state law that requires a certain level of local spending on streets and roads. State law allows, but does not require, the State Controller to audit cities and counties to ensure that they maintain specified levels of local spending each year. However, the State Controller has only conducted reviews of local streets and roads spending, and it maintains that such reviews do not allow it to enforce the requirement. As a result, there are no consequences if cities and counties repeatedly fail to meet their required local spending levels.
Respectfully submitted,
GRANT PARKS
California State Auditor
Selected Abbreviations Used in This Report
| CalEPA | California Environmental Protection Agency |
| CalSMART | California Statewide Multi‑Modal Application and Reporting Tool |
| PCI | Pavement Condition Index |
| SB1 | Senate Bill 1—the Road Repair and Accountability Act of 2017 |
Summary
The Legislature created the Local Streets and Roads Program (program) in 2017 to provide funding to cities and counties to address the long‑term deterioration of their streets and roads. This program provided nearly $1.5 billion to cities and counties in fiscal year 2022–23. The California Transportation Commission (Commission) administers the eligibility and expenditure‑reporting processes that state law requires cities and counties to follow. The California State Controller’s Office (State Controller) distributes program funds to cities and counties each month, and state law authorizes it to monitor local spending.
State Agencies Are Properly Administering Program Eligibility, Payment, and Reporting Processes
We reviewed the processes and documentation that the Commission and State Controller use to administer the Local Streets and Roads Program. We found that these processes are appropriate and allow these state agencies to provide funding to all eligible cities and counties in California. The Commission facilitates the program’s transparency to the public by hosting a website that publishes comprehensive program information, including detailed expenditure reports that identify how cities and counties use program funds.
Although the Cities We Reviewed Are Appropriately Using Local Streets and Roads Program Funding, Most Still Have Deteriorating Road Conditions
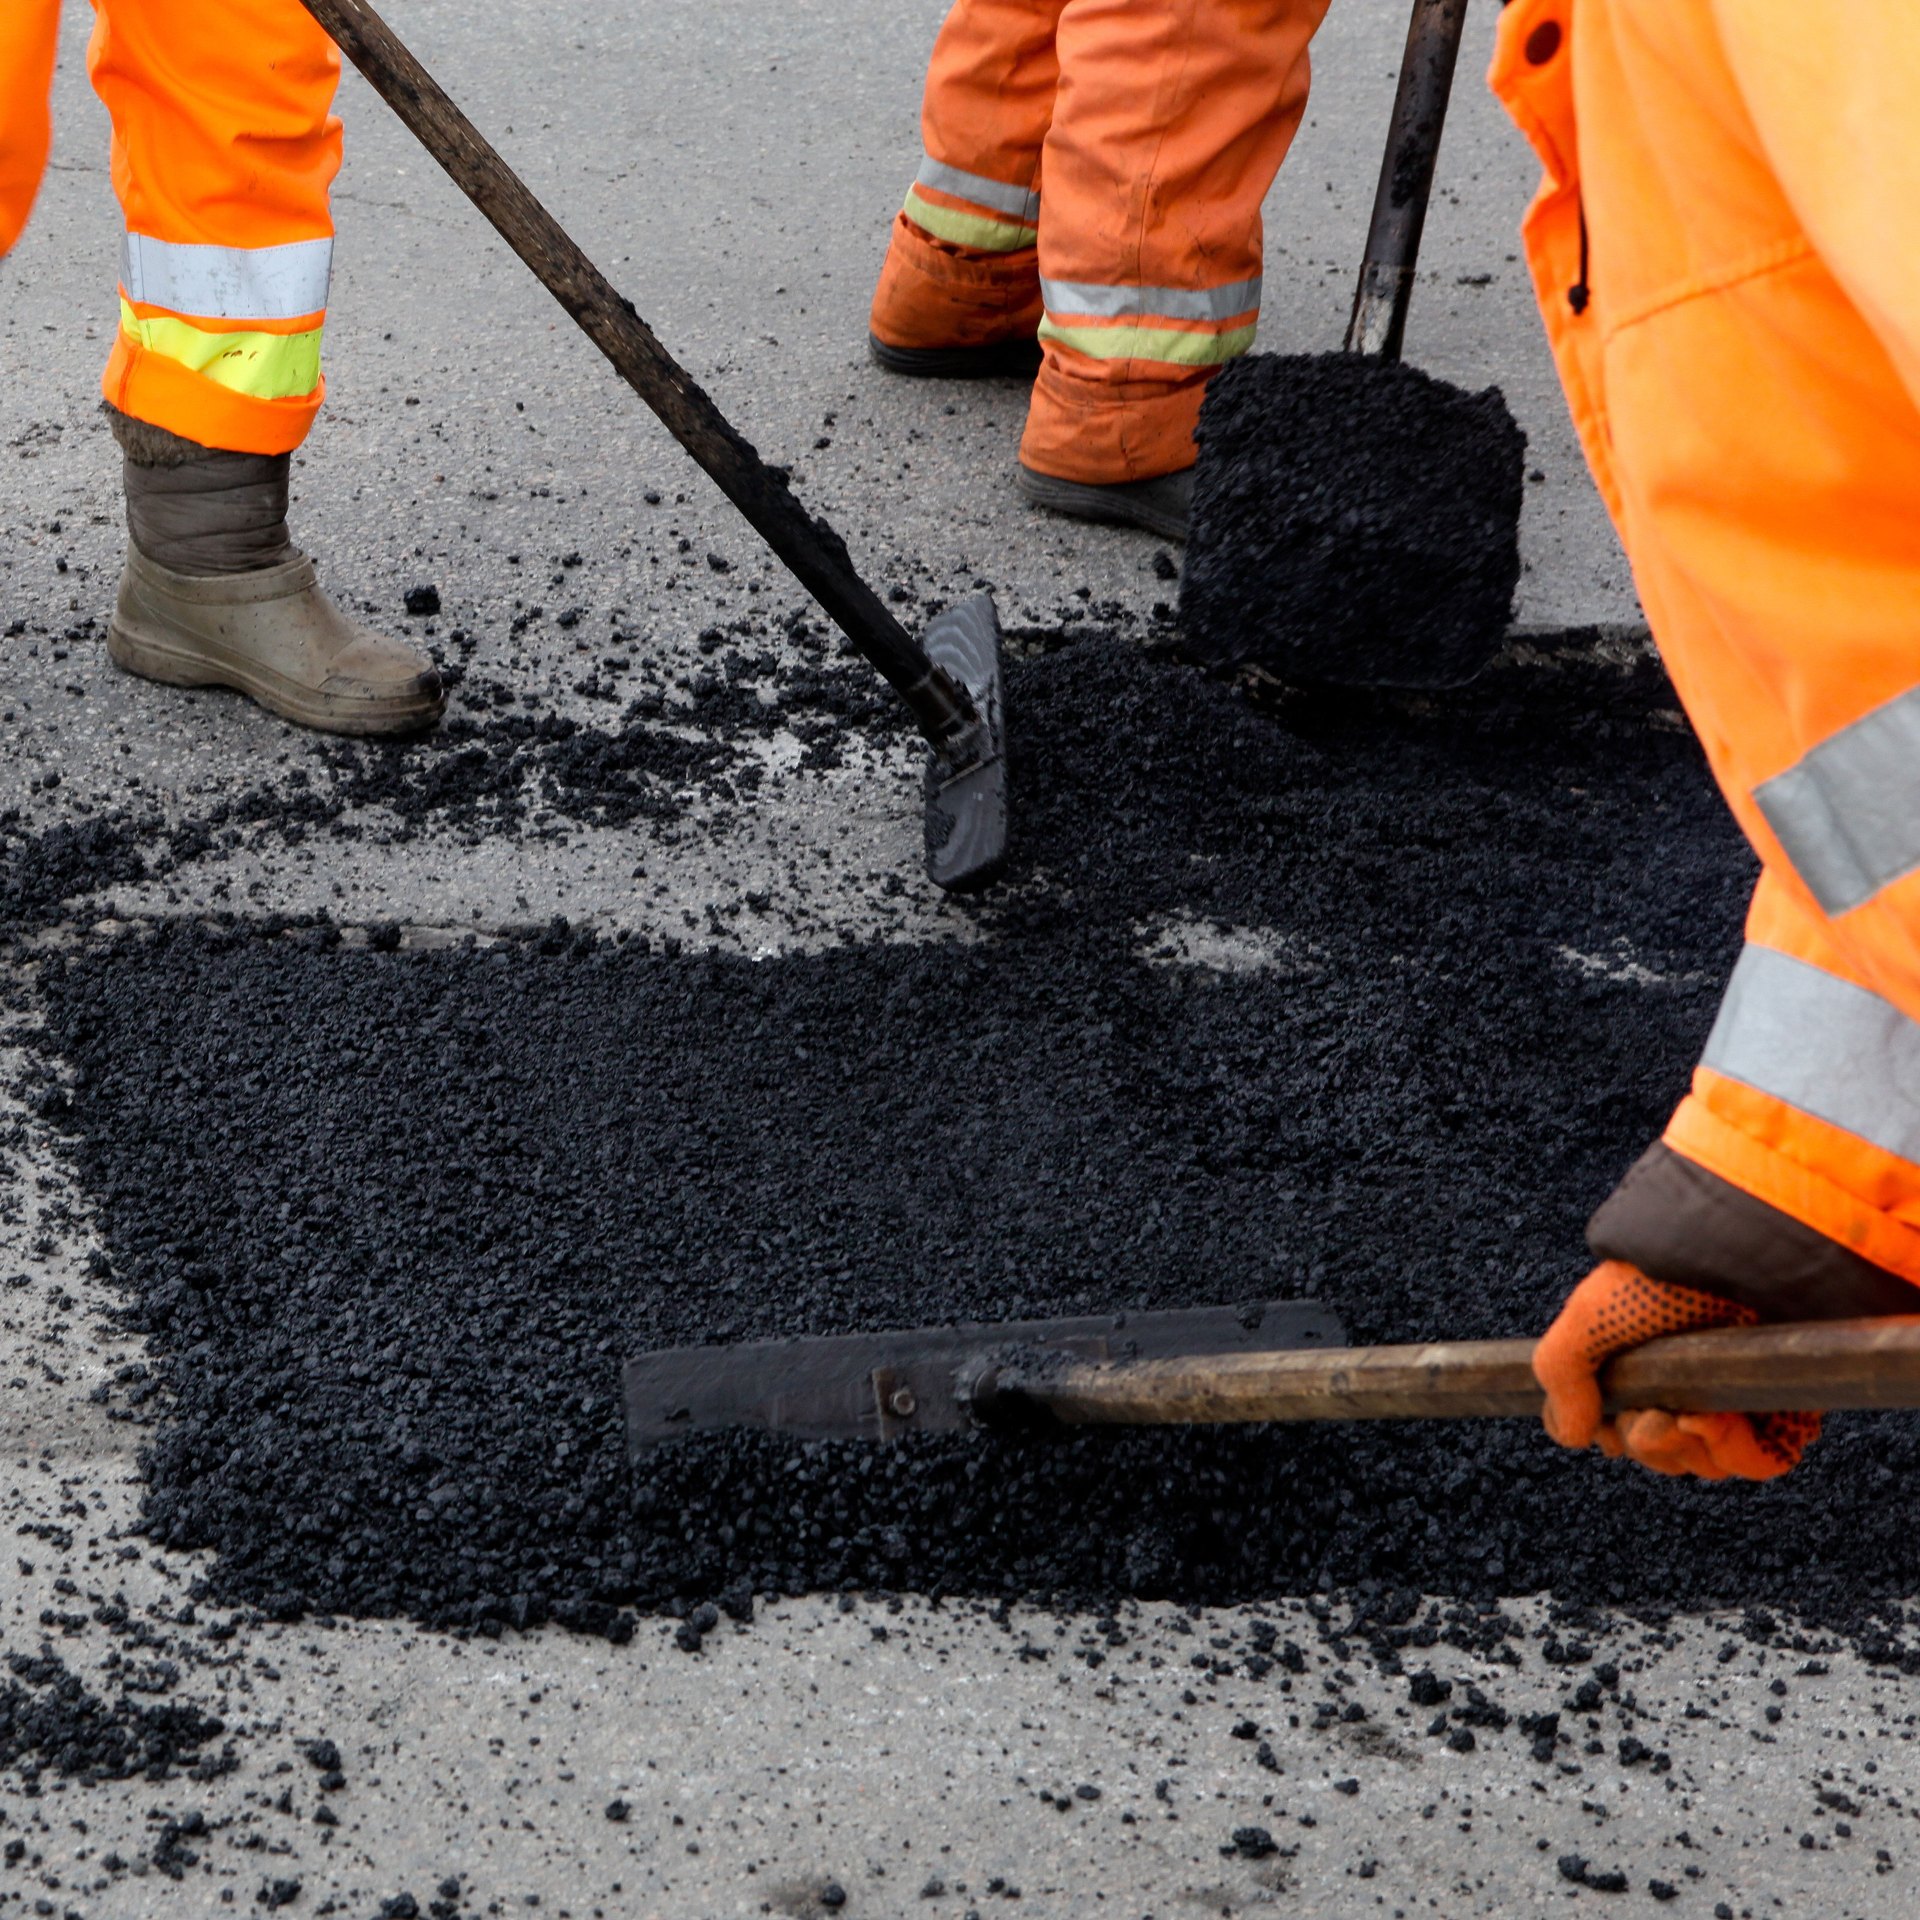
We reviewed a selection of six cities—Baldwin Park, Bell, Coronado, Oakland, Riverside, and Yuba City—to determine how they spent program funds and found that they adhered to program requirements and generally spent the majority of the funds on maintaining and rehabilitating their streets. However, despite the additional resources that the program provides, the cities have generally been unable to improve the overall condition of their streets. The cities noted that they would need significantly more funding to improve the overall condition of their streets, and some cities have sought additional financial resources to do so, such as through a bond measure.
The State Controller Has Not Held Cities Accountable for Maintaining Local Spending on Streets and Roads
The Legislature established that cities and counties cannot use program funds to replace previous local spending on streets and roads and authorized the State Controller to monitor their compliance with this maintenance of effort requirement. We found that the six cities we reviewed met this requirement. However, the State Controller explained that despite identifying some cities that potentially have not met this requirement for multiple years, it does not have adequate staffing to conduct audits to ensure that cities and counties are meeting the Legislature’s expectation in this area. Further, the State Controller’s interpretation of state law reduces accountability for the cities that it has identified as potentially not meeting the requirement. Because of its interpretation, the State Controller does not require cities to make up for deficits in meeting the maintenance of effort requirement within the statutorily allowable two year period. Finally, the State Controller’s interpretation of state law and how much it should withhold from cities and counties that do not meet the maintenance-of-effort requirement is overly punitive and may not reflect the Legislature’s intent.
Agency Comment
The State Controller agreed with our recommendations and provided additional perspective on its staffing levels and interpretation of state law.
Introduction
Background
In 2017 the Legislature found that California faced a $59 billion shortfall in funding to adequately maintain the state highway system over the next decade, and that cities and counties faced a $78 billion shortfall in funding to adequately maintain their streets and roads over that same time period. In response, the Legislature passed Senate Bill 1 (SB1)—the Road Repair and Accountability Act of 2017—to improve the condition of the State’s road system. To fund these efforts, SB1 added or raised several existing taxes and fees, as the text box shows. In passing SB1, the Legislature determined that the funding would have a positive impact on the economy by lowering the transportation‑related costs of doing business, reducing traffic congestion for employees, and protecting property values in the State. SB1 provides funding for many different state and local programs, as Table 1 shows. The Local Streets and Roads Program (program), which is the focus of this audit, receives the second‑largest amount of funding and is the largest local program, receiving an average of nearly 29 percent of SB1’s total available funding.
Taxes and Fees Added or Increased by SB1:
- Diesel fuel tax increase of $0.20 per gallon, indexed to inflation.
- Diesel fuel tax added to sales tax.
- Gasoline tax increase of $0.12 per gallon, indexed to inflation.
- Fuel storage fee.
- Transportation improvement fee required during vehicle registration.
- Registration tax for zero emission vehicles.
Source: State law.
Among the other local programs SB1 funds, is one program for local transit operations and capital improvement projects that the Legislature estimated would have $750 million each year available for allocation. It also funds the Local Partnership Program, which provides funding to local and regional transportation agencies that have sought and received voter approval of taxes or that have imposed fees that are dedicated solely for transportation improvements to fund road and highway improvements. Further, SB1 provides funds for the Active Transportation Program, which provides funding to encourage increased use of active modes of transportation, such as biking and walking, and grants to local and regional agencies to assist planning for climate change.
Local Streets and Roads Program Requirements
State law generally establishes five allowable uses of Local Streets and Roads Program funds. Cities and counties may spend these funds on road maintenance and rehabilitation, safety projects, grade separation from railroads, complete street components when paired with any other allowable project, and traffic control devices, among other things.1 Road maintenance and rehabilitation includes activities such as repaving streets and sealing cracks in pavement. Safety projects can include adding infrastructure, such as signage, for safe routes to school. Complete streets projects include pedestrian and bicycle safety projects and transit facilities projects.
To be eligible to receive program funds, cities and counties must submit certain information and documentation to the Commission. The text box shows the information that the Commission requires cities and counties to submit. Among the required documents is a resolution and proposed project list, approved by the applicable city council or county board of supervisors. Because the city council or county board of supervisors must adopt the resolution during a regular public meeting, this requirement provides transparency in how cities and counties propose to spend program funds. State law does not require the Commission to approve the proposed projects or provide authorization to proceed with specific projects. Instead, the Commission’s role is ministerial in nature—it receives and reviews project lists and resolutions to ensure that they are complete and therefore comply with statutory requirements. The Commission then adopts and submits a statewide list of eligible cities and counties to the State Controller so the State Controller can distribute funds to the cities and counties in monthly payments. The text box describes the roles and responsibilities of state and local agencies for the program.
Requirements for Cities and Counties to Submit Specific Information to Demonstrate Eligibility for Program Funds
- Signed and adopted resolution by the applicable city council or county board of supervisors that includes the following:
- Use of Local Streets and Roads Program funds reference
- Reference to list of proposed projects
- List of projects the city or county proposes to spend program funds on, including the following:
- Project description and location
- Estimated schedule for completion
- Estimated useful life
Source: Commission.
Local Streets and Roads Program Roles and Responsibilities
Commission
- Receive and review project lists from cities and counties and ensure compliance with requirements.
- Provide technical assistance to cities and counties.
- Provide list of eligible cities and counties to State Controller.
- Receive and publish expenditure reports.
State Controller
- Receive list of cities and counties eligible for funds.
- Distribute funds to cities and counties.
- Oversee local spending requirements.
Cities and Counties
- Develop and submit list of projects to the Commission.
- Submit annual expenditure reports to the Commission.
Source: State law.
The Commission provides flexibility to cities and counties by providing two deadlines to submit required information. The Commission requires cities and counties to submit project information and documentation of their resolutions to it each year by July 1. If a city or county does not meet this deadline, the Commission allows it to obtain what is known as subsequent eligibility by submitting the required information before September 30 without penalty.
Each fiscal year, cities and counties must report their spending to the Commission. State law allows cities and counties to spend program funds on projects that were not included in the lists they had previously submitted to the Commission. This flexibility allows cities and counties to respond to changing conditions, such as a storm’s damage to streets and roads or a planned project’s schedule changes. State law requires cities and counties to report specific information about their spending to the Commission, as the text box describes. The Commission has established a December 1 deadline for cities and counties to submit their spending information each year. After the Commission receives all of the spending information, it publishes that information on its website. Making the spending information available to the public facilitates transparency and accountability because interested members of the public may review the reports and follow up with cities and counties for additional information. Figure 1 provides an overview of the program and reporting requirements.
Reporting Requirements for Program Spending
- Description of each project that used program funds.
- Location of each completed project.
- Amount of funds spent.
- Completion date.
- Estimated useful life.
Source: State law.
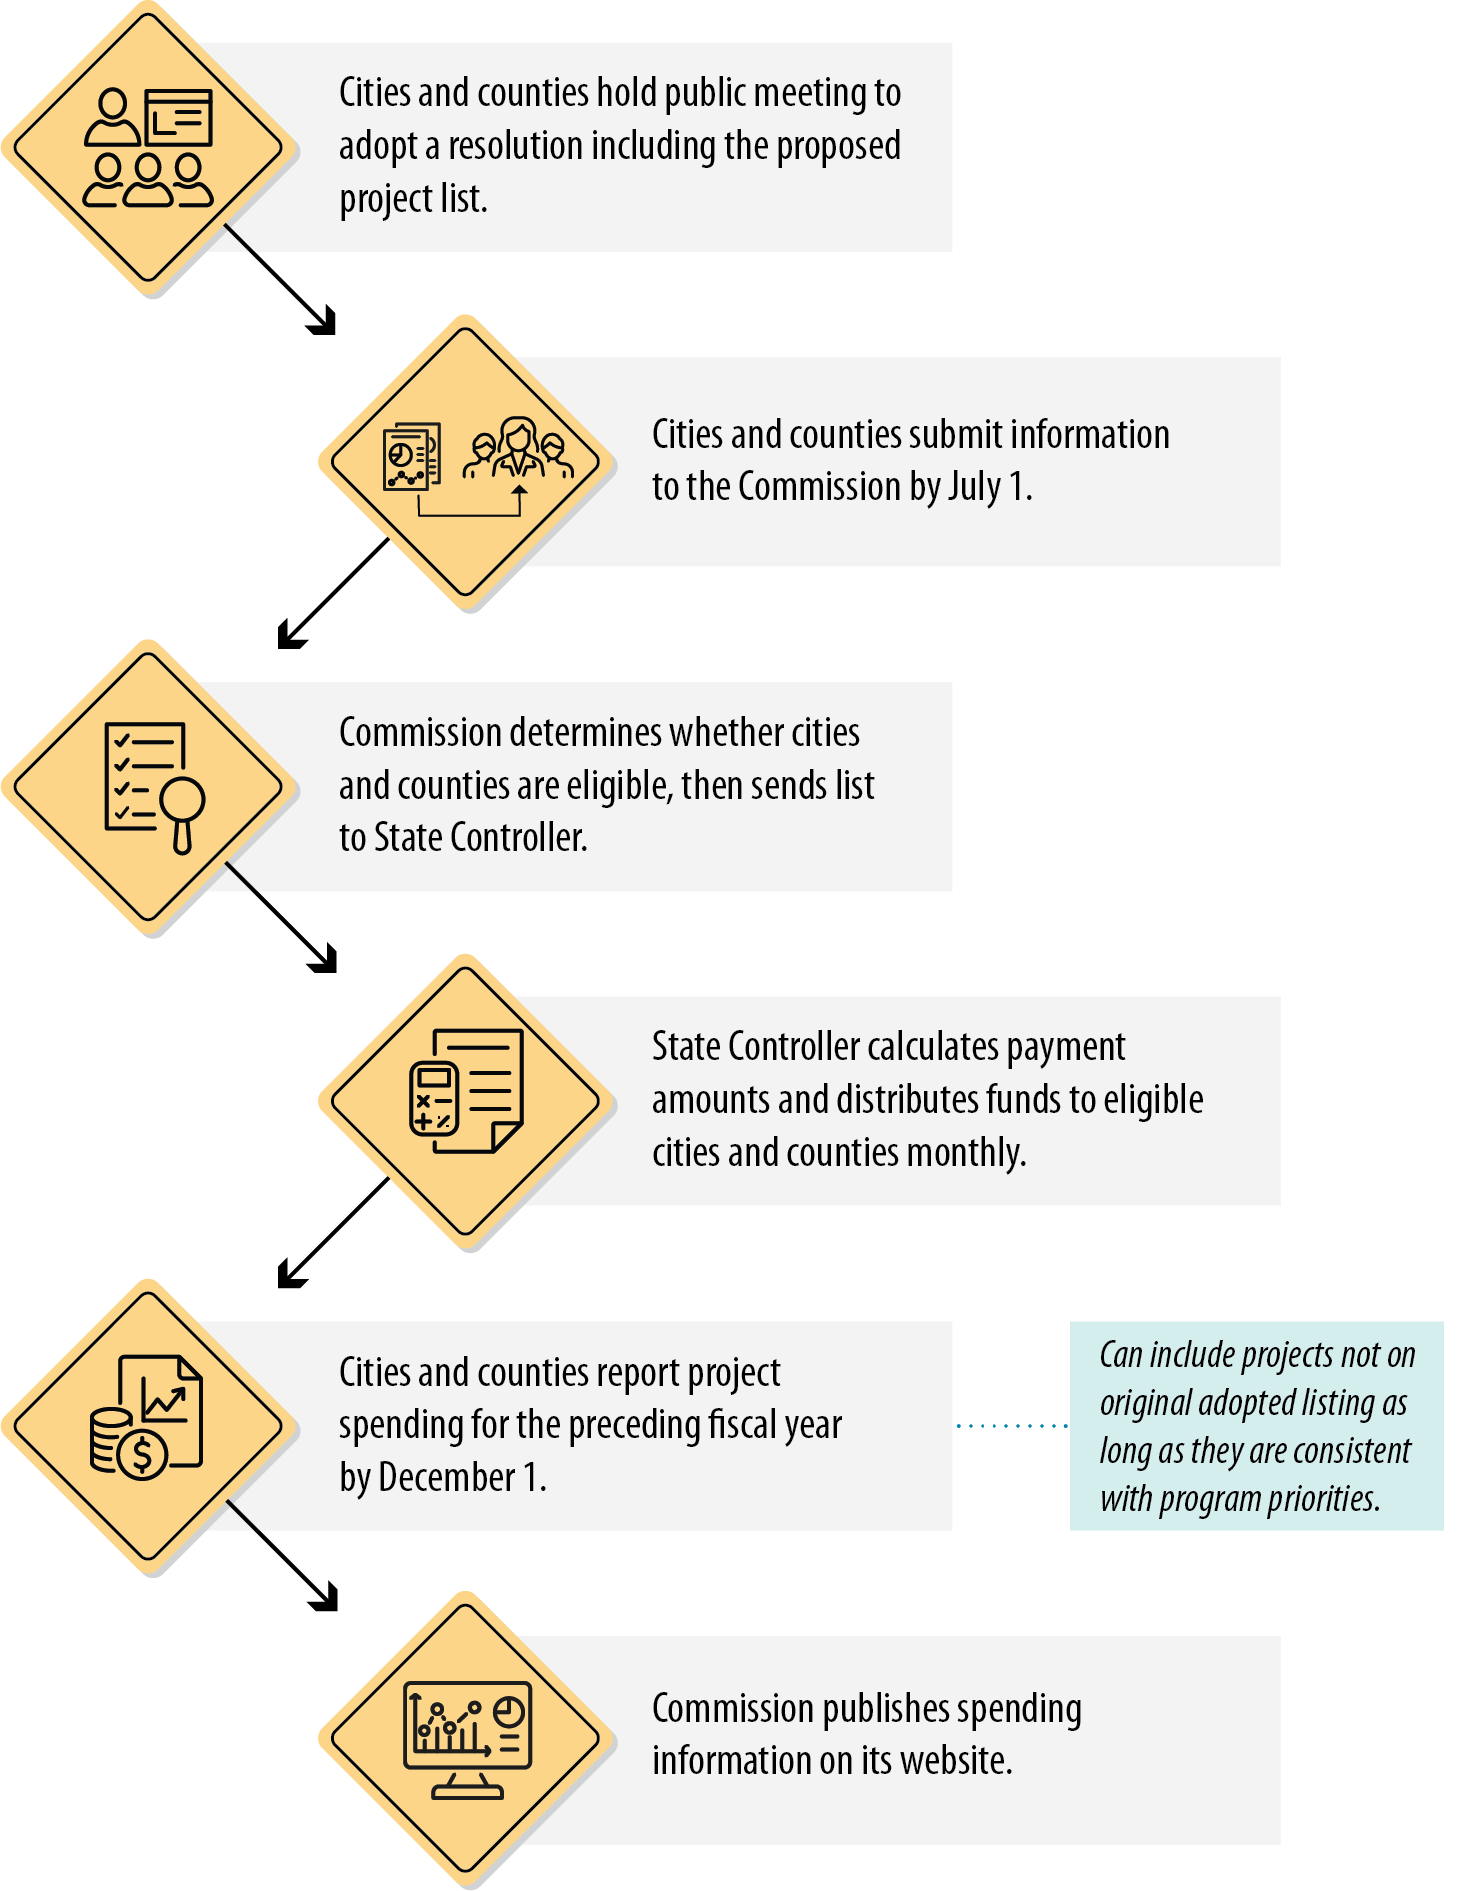
Figure 1
Summary of the Local Streets and Roads Program Eligibility and Reporting Process
Source: State law, Commission guidelines, and the State Controller.
Note: Cities and counties that did not meet the July 1 deadline may hold a public meeting to adopt a resolution with the proposed project list and then submit the information to the Commission by September 30.
Figure 1 is a flowchart that summarizes the Local Streets and Roads Program eligibility and reporting process. At the top, the process starts with Cities and Counties holding a public meeting to adopt a resolution, including the proposed project list. Then Cities and counties submit information to the Commission by July 1. The Commission determines whether cities and counties are eligible, then sends that list to the State Controller. The State Controller calculates payment amounts and distributes funds to the eligible cities and counties each month. Cities and counties report project spending for the preceding fiscal year by December 1, which can include projects that were not on the original adopted listing, as long as they are consistent with program priorities. Finally, the commission publishes the spending information on its website. Note that cities and counties that did not meet the July 1 deadline may hold a public meeting to adopt a resolution with the proposed project list and then submit the information to the Commission by September 30.
The Commission provides an online reporting tool to help cities and counties submit required information for program eligibility and report expenditures in accordance with state law. Since 2019 the Commission has required cities and counties to use the California Statewide Multi‑Modal Application and Reporting Tool (CalSMART) to submit information so that the Commission can determine their eligibility for the program. Several transportation programs, such as the Local Partnership Program and the Active Transportation Program, also use this database to facilitate reporting. CalSMART promotes statewide consistency in the content and format of project information that local governments submit to the Commission and facilitates transparency within the Local Streets and Roads Program. CalSMART uses fields that are mandatory for cities and counties to complete and that correspond to program requirements. This requires cities and counties to submit the necessary information before completing the eligibility process.
Maintenance‑of‑Effort Requirement
In addition to reporting spending information to the Commission, cities and counties also must report expenditure information to the State Controller. To participate in the program, cities and counties must maintain a minimum level of local spending on their streets and roads, as state law requires. This required minimum level of local spending is referred to as the maintenance‑of‑effort requirement. Although cities and counties may use other sources of funding—including state grants—for their streets and roads projects, their maintenance‑of‑effort spending must come from local resources, such as certain local tax revenues. This requirement helps to ensure that cities and counties do not replace their local spending on streets and roads with state funding from the program. As a remedy, if cities or counties do not meet this requirement, state law provides a process for the State Controller to withhold program funding in future fiscal years.
State law provides some flexibility for cities and counties that do not meet the maintenance‑of‑effort requirement. State law established that the maintenance‑of‑effort requirement for a city that was incorporated before July 1, 2009, and each county, is the average of their local streets and roads spending during fiscal years 2009–10, 2010–11, and 2011–12. The law provides an alternative calculation for cities incorporated after July 1, 2009. In response to the pandemic, the Legislature reduced this level for any city or county that experienced a decrease in taxable sales from fiscal years 2018–19 through 2019–20, in proportion to that decrease. The Legislature did not continue this flexibility after fiscal year 2021–22. State law allows any cities or counties that do not meet their maintenance‑of‑effort requirement in a particular fiscal year to spend additional funds in the following fiscal year in the amount they were deficient, as Figure 2 shows.
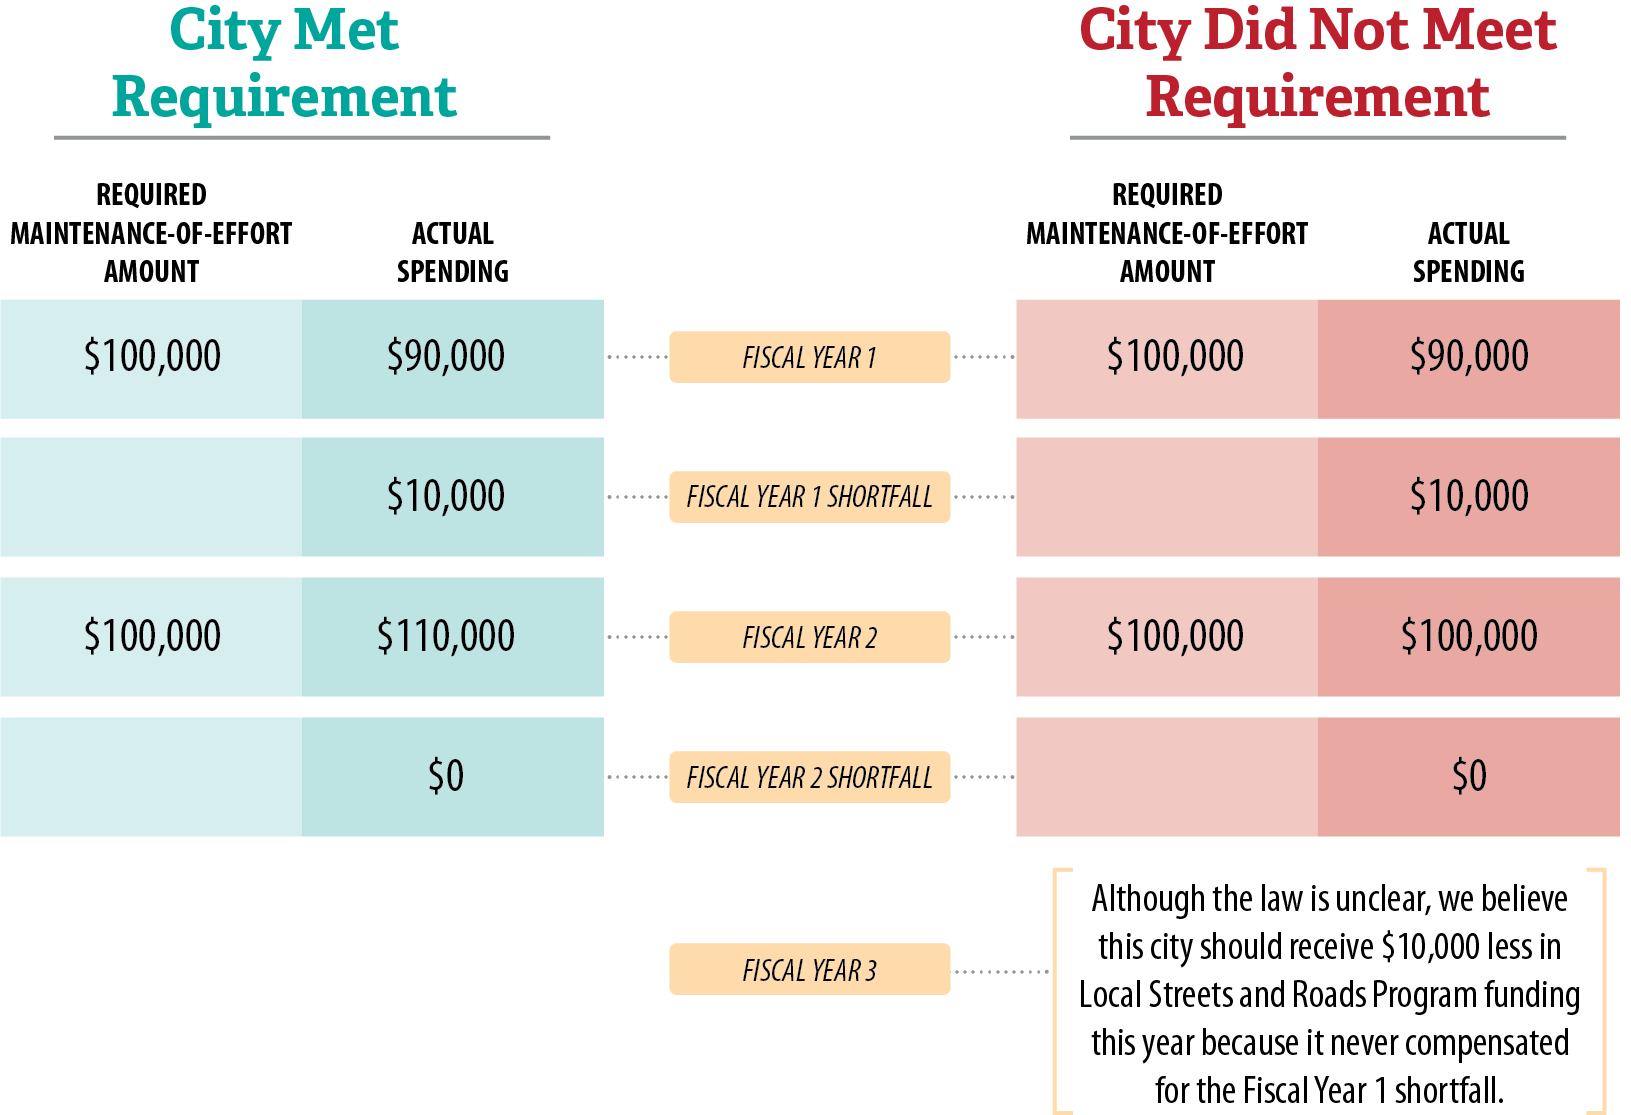
Figure 2
Hypothetical Example of How State Law Intends Cities to Meet the Maintenance‑of‑Effort Requirement or Face Withholding of Program Funds
Source: Auditor analysis of state law.
Figure 2 shows two hypothetical examples side-by-side over a three-year period of a city that met the maintenance-of-effort requirement and a city that did not meet the requirement. The first city shows a maintenance-of-effort requirement of $100,000 but actual spending of- only $90,000 in the first year, indicating a $10,000 shortfall. In the second fiscal year the city spends $110,000, indicating that it met the maintenance-of-effort requirement of $100,000 and made-up the shortfall from the prior year. The second city with the same $100,000 maintenance-of-effort requirement and actual spending of $90,000 in year one, also has a $10,000 shortfall. In year two, the city has actual spending of $100,000, which means it had no shortfall in year two. However, it did not make-up the shortfall from the first year. Therefore, in year three the city should receive $10,000 less in Local Streets and Roads Program funding because it never compensated for the shortfall in year one.
Funding Distribution
State law establishes how the State Controller must distribute program funds to cities and counties, specifying that the State Controller must provide half of available program funding to cities and half to counties, as Figure 3 shows. For cities, the State Controller must proportionally distribute the funds available to cities according to each city’s proportion of the population of all cities in the State. For example, if a city has 1 percent of the total population of all cities in the State, the State Controller would distribute 1 percent of available funds to that city. For counties, the State Controller must review both the number of vehicles registered in each county and the county’s total miles of roads. Of the funds available to counties, state law requires the State Controller to distribute three‑quarters of the funding according to each county’s proportion of all registered vehicles in the State. The law then requires the State Controller to proportionally distribute the remaining quarter of county funding to each county according the number of miles of maintained county roads in each county in proportion to all miles of maintained county roads in the State. This formula was adopted in statute for other purposes before the gas tax increase that SB1 authorized in 2017, and state law uses this formula to distribute funds for this program. Appendix Table A.1 provides the funding distributions to, and populations of, each city, and Table A.2 provides the funding distributions for each county with its corresponding number of registered vehicles and maintained road miles. This information from fiscal year 2022–23 is the most current information available from the State Controller.
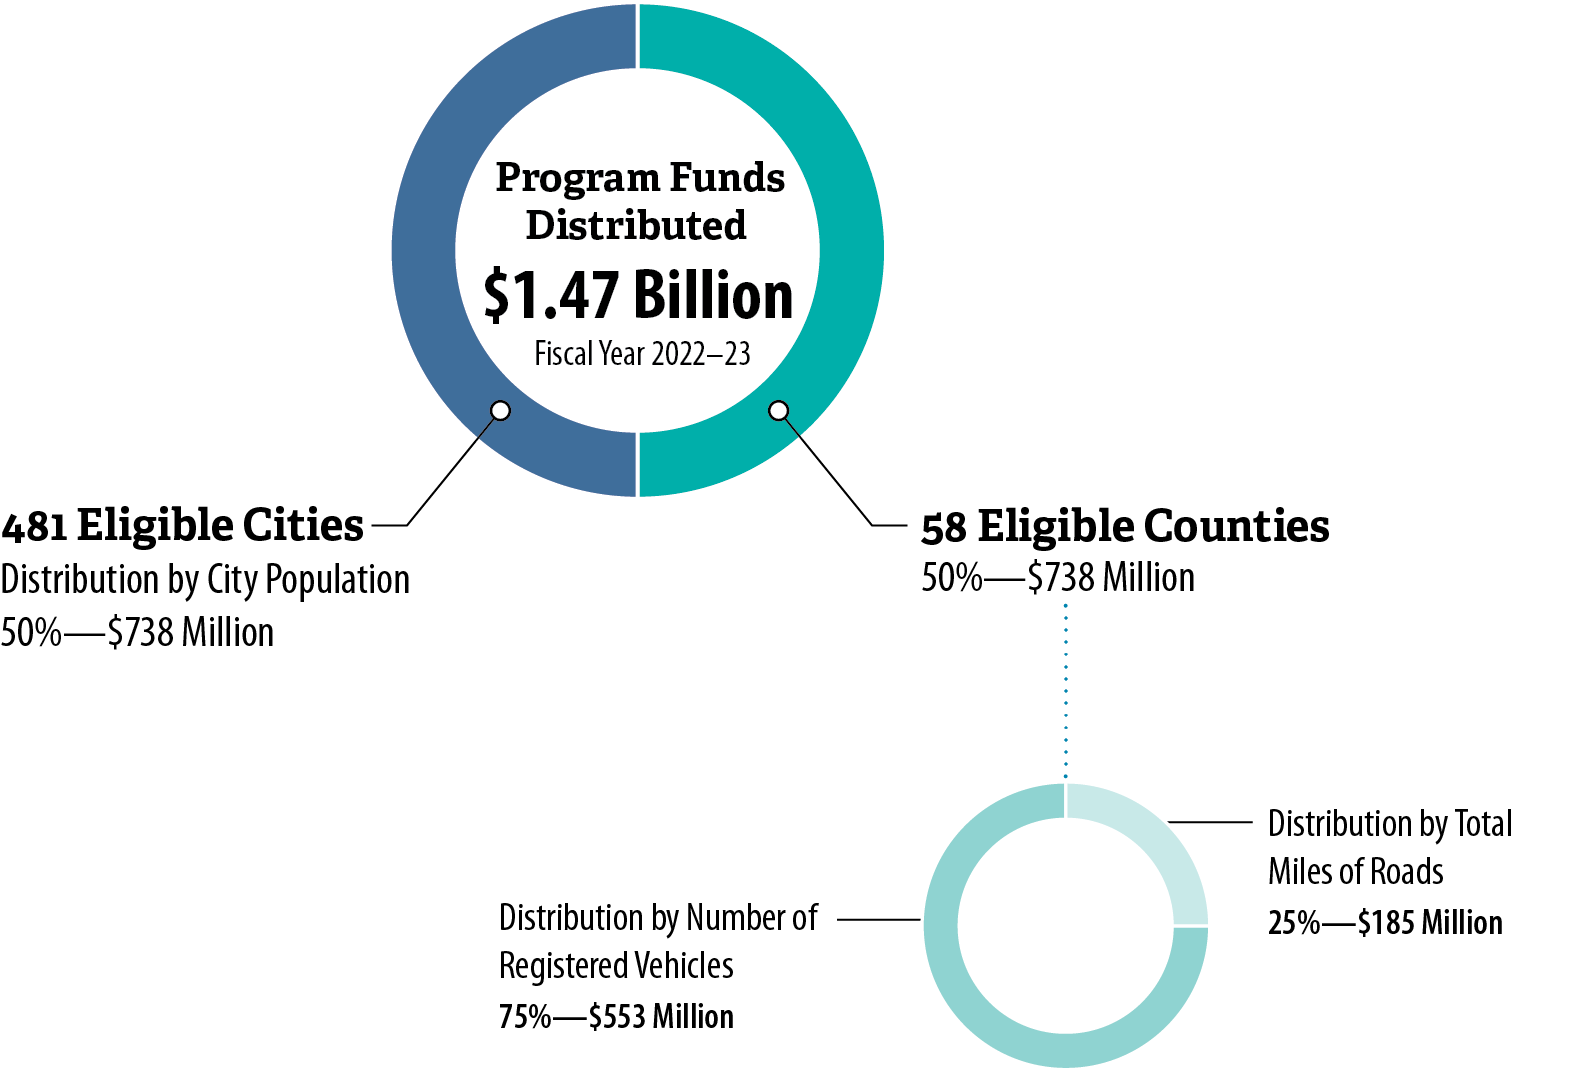
Figure 3
State Law Establishes How Local Streets and Roads Program Funds Are Distributed Among Eligible Cities and Counties Each Year
Source: State law.
Note: Half of the program funds are designated for eligible cities and half for eligible counties. The cities’ funds are distributed by city population. The counties’ funds are further divided, with 25 percent distributed according to each county’s total miles of roads and 75 percent distributed according to each county’s total number of registered vehicles.
Tables A.1 and A.2 in the Appendix provide specific distributions from fiscal year 2022–23 for each of the state’s cities and counties, respectively.
Figure 3 shows a pie chart of how Local Streets and Roads Program Funds are distributed among eligible cities and counties each year according to State law. It shows that half the funds displayed in the pie chart goes to the 481 eligible cities, which is $738 million in fiscal year 2022-23. This amount is distributed based on city population. The other half of the pie chart goes to the 58 eligible counties, which also received $738 million of the $1.47 billion total in fiscal year 2022-23. From the half of the pie chart going to eligible counties, the figure shows another, smaller pie chart which shows how the county funds are apportioned. This pie chart has which 75 percent of the $738 million, or $553 million, being allocated based on the number of registered vehicles, and 25 percent, or $185 million, being allocated based on the total miles of roads.
Although state law does not require economic or racial equity for distributing program funds, state law provides for equal distribution of available funds to cities according to population. Every city received the same per capita funding in each of the three monthly payments we reviewed, demonstrating that the State Controller applied the formula correctly. We calculated that cities received between $1.57 per person per month in April 2021 and $1.91 in August 2023. We calculated the per capita funding for cities because their distribution is based on population. However, because counties receive funds based on different criteria, the same calculation would not provide comparable results.
Although the program does not explicitly address equity, other state, regional, and local programs address equity for disadvantaged communities more directly. The Active Transportation Program, funded in part by SB1, as Table 1 showed, requires the Commission to award 25 percent of funding to projects in disadvantaged communities.2 State law provides the California Environmental Protection Agency (CalEPA) with the responsibility of identifying those communities according to geographic, socioeconomic, public health, and environmental hazard criteria, although this program allows for other definitions of disadvantaged communities. State agencies and the Strategic Growth Council use CalEPA’s identification of disadvantaged communities to target their expenditures and resources. Regional transportation planning agencies, which in addition to planning also mediate between federal funding sources and cities and counties, assert on their public websites that they incorporate equity into their processes for selecting projects to fund. Some cities also consider equity as a factor when prioritizing projects.
Road Condition Measurement
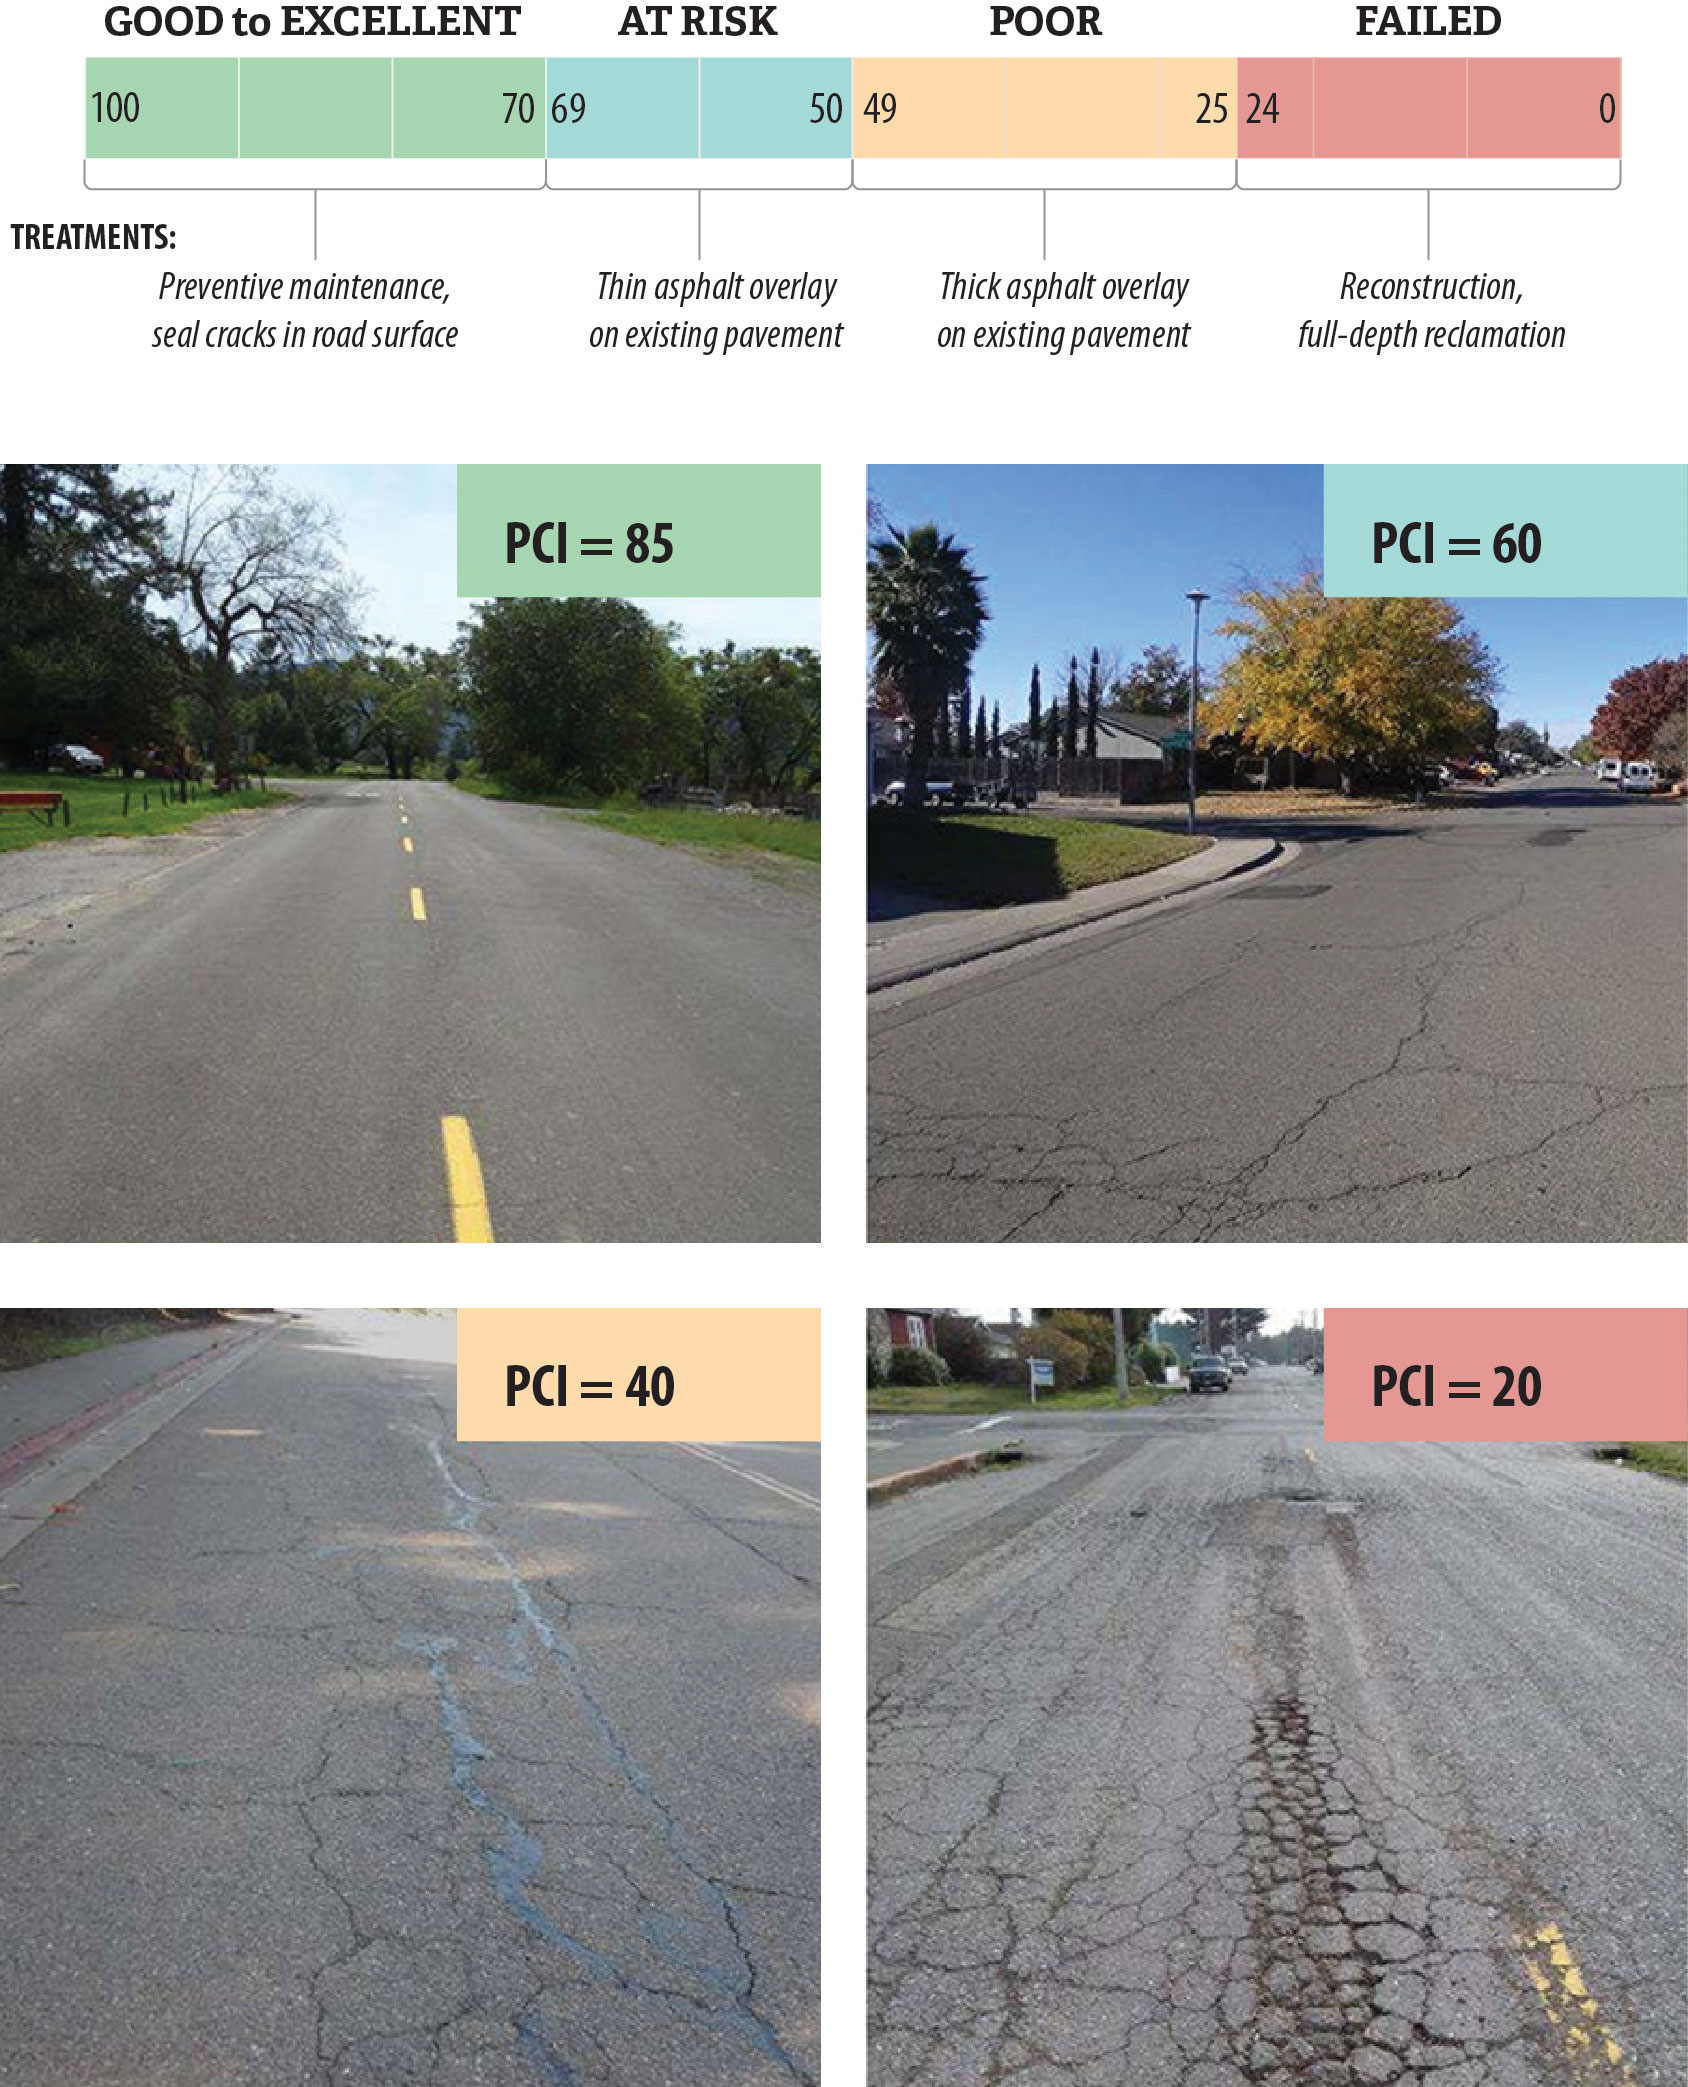
Cities use the Pavement Condition Index (PCI) to measure pavement conditions. PCI is a standard numerical rating between 0 and 100 that categorizes pavement condition by the type and severity of distresses observed on the pavement surface. A PCI value of 0 indicates that a road is in the worst possible condition; a value of 100 indicates that a road is in the best possible condition. The PCI scale is divided into four general condition categories, as Figure 4 shows. Pavements in “Good to Excellent” condition have a PCI at or above 70; pavements in “At Risk” condition have a PCI from 50 to 69; pavements in “Poor” condition have a PCI from 25 to 49; and pavements in “Failed” condition have a PCI at or below 24. Figure 4 also presents photographic examples of roads in each of these four categories.
Figure 4
The PCI Is a Tool That Rates Pavement Surfaces and Indicates Treatments
Source: California Statewide Local Streets and Roads Needs Assessment, August 2021, and Pavement Management Program Update, City of Yuba City, September 2023.
Figure 4 shows a horizontal bar with the four major categories of the Pavement Condition Index from 100 to 70 being “Good to Excellent”, 69 to 50 being “At Risk”, 49 to 25 being “Poor”, and 24 to zero being “Failed”. It also shows photographic examples of roads in each of these four major categories. In one example it shows a road in good condition with smooth pavement without any cracks at a PCI of 85. The next photo has a road with some small, linear cracks in the asphalt at a PCI of 60. The third photo shows a road with many interconnected, large cracks in the asphalt at a PCI of 40. The final photo shows a road surface that is failing, with very rough pavement surface, large potholes, more cracked than solid pavement, and portions of the roadway coming loose at a PCI of 20.
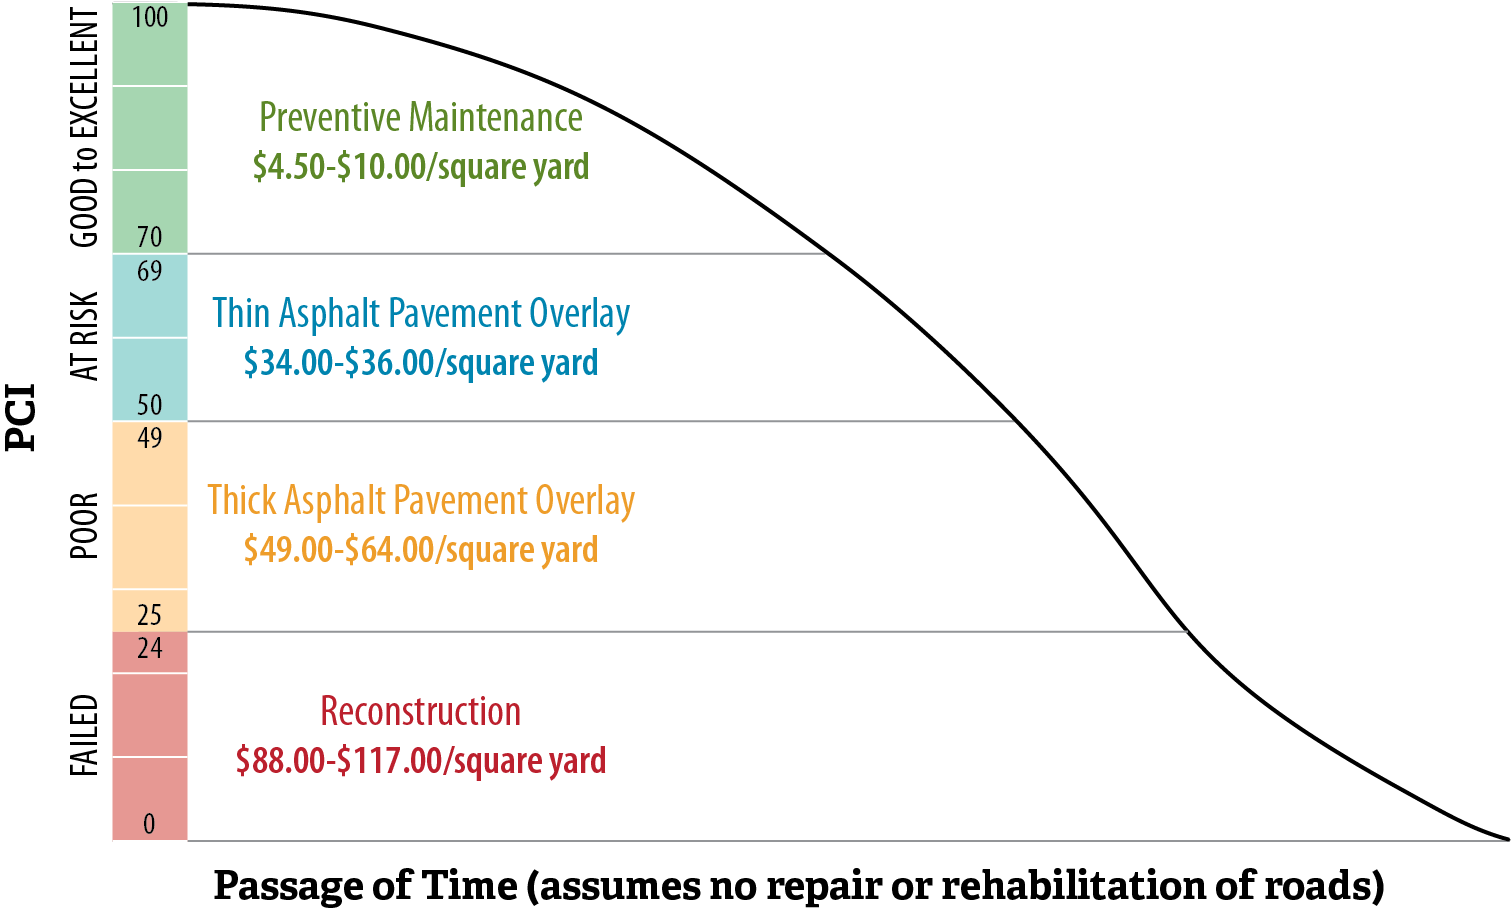
The cost to repair roads in the “Poor” and “Failed” PCI categories is significantly higher than for those in better condition. If a road is not maintained, it will need repairs; if it remains unrepaired, it will fail over time. As roads are used over time, the deterioration of the road surface can increase significantly. Cities and counties are able to extend the useful life of streets and roads by performing preventive maintenance. However, as Figure 5 shows, the cost to maintain and repair roads varies significantly according to their PCI, with significantly higher costs for “Poor” and “Failed” roads.
Figure 5
Example of Costs to Repair and Rehabilitate Roads in Sacramento by PCI
Source: Sacramento’s Department of Public Works Pavement Condition Report, August 2022.
A line graph with the Pavement Condition Index (PCI) on the vertical axis, and the passage of time on the horizontal axis. The vertical axis shows the four major categories of PCI, with 100 at the top and zero at the bottom, from 100 to 70 being “Good to Excellent”, 69 to 50 being “At Risk”, 49 to 25 being “Poor”, and 24 to zero being “Failed”. The line starts at the top of the graph at 100 PCI and slopes downwards to the right. Within each PCI category it describes the type of work that needs to be completed at that stage and its range of costs per square yard. In the “Good to Excellent” category it says preventative maintenance, $4.50 to $10 per square yard. In the “At Risk” category it says thin asphalt pavement overlay, $34 to $36 per square yard. In the “Poor” category it says thick asphalt pavement overlay, $49 to $64 per square yard. In the “Failed” category, it says $88-$117 per square yard. This indicates that the cost to maintain and repair roads raises significantly as PCI declines, with significantly higher costs for “Poor” and “Failed” roads.
Issues
State Agencies Are Properly Administering Program Eligibility, Payment, and Reporting Processes
Although the Cities We Reviewed Are Appropriately Using Local Streets and Roads Program Funding, Most Still Have Deteriorating Road Conditions
The State Controller Has Not Held Cities Accountable for Maintaining Local Spending on Streets and Roads
The State Controller Has Not Held Cities Accountable for Maintaining Local Spending on Streets and Roads
Key Points
- State law authorizes—but does not require—the State Controller to audit cities and counties to ensure that they are not replacing local spending with program funds. The State Controller has not performed any audits to ensure that they comply with program requirements, even though dozens of cities may not have spent sufficient local funds.
- State law does not provide sufficient time for cities and counties to resolve issues involving insufficient spending of local funds on streets and roads. The one‑year window that state law provides for cities and counties to increase local spending actually provides only approximately one month for them to do so, which is generally not possible.
- The State Controller’s interpretation of state law does not allow it to hold cities accountable if they do not meet local spending requirements.
The State Controller Has Not Audited Cities or Counties to Ensure That They Maintain Their Required Local Spending on Streets and Roads
State law requires cities and counties to maintain a minimum level of local spending on their streets and roads; this minimum level is referred to as maintenance of effort. The law specifically requires cities and counties to provide the State Controller with an annual report on all of their spending on streets and roads, and the State Controller reviews that information to determine whether each city and county has met the maintenance‑of‑effort requirement. In addition, state law authorizes—but does not require—the State Controller to perform audits to ensure that cities and counties are meeting the maintenance‑of‑effort requirement. State law establishes penalties for cities and counties that do not meet the requirement: following an audit, the State Controller must withhold future funding in an amount up to the amount of funds that the city or county received during the fiscal year that was audited.
Although the State Controller performs some limited reviews of whether cities and counties are meeting the maintenance‑of‑effort requirement, it does not perform formal audits. Typically, a review is substantially less in scope than an audit. The text box lists some of the key elements of an audit. In December of each year, state law requires cities and counties to provide the State Controller with a complete report of the expenditures for street or road purposes during the preceding fiscal year. Instead of using this information to perform an audit, the State Controller only reviews it. Specifically, its review procedures direct staff to identify the funding sources of the reported amounts and to assess whether the city or county met the maintenance‑of‑effort requirement. The State Controller explained that in some cases, it will request additional information, such as details about the sources of funds spent, to inform its review.
Key Elements of Audits
- Planning the audit scope.
- Assessing internal controls.
- Obtaining sufficient and appropriate evidence.
- Conducting supervisory review.
- Reporting on the conclusions based on the audit objectives and findings.
Source: Government auditing standards.
When the State Controller identifies a city or county that did not meet its maintenance‑of‑effort requirement, the Controller’s practice is to inform the city or county that it must spend additional funds in the current fiscal year to make up for the spending shortfall from the prior fiscal year. The State Controller asserts that to maintain compliance with program requirements, the city or county must spend a specified additional amount, which the State Controller identifies, during the current fiscal year. The State Controller noted that its reviews are not audits and cannot be used as a basis for withholding funding from cities or counties. This is problematic because without the State Controller conducting audits and withholding funding, cities or counties may evade their responsibility for maintaining local spending on streets and roads. We calculated the total amount that cities underspent to meet their maintenance‑of‑effort requirements for fiscal year 2020–21 using the results of the State Controller’s reviews. We found that the total amount that cities underspent was nearly $10.7 million, or about 1 percent of the nearly $950 million that all cities in the State were required to spend to meet their maintenance‑of‑effort requirement for that fiscal year.
Although the State Controller performed reviews of cities and counties and identified instances of potential noncompliance, it did not take additional steps to enforce state law. As Table 5 shows, for fiscal years 2017–18 through 2021–22, the State Controller sent 168 notices of potential noncompliance to cities and counties that spent less local funding than required.3 Although these notices flag potential noncompliance, the cities and counties still have an opportunity to increase their spending of local funds during the following, or second, fiscal year to make up for the amount they underspent. The State Controller did not send notices to the same county twice. However, in 27 instances across 21 cities, the State Controller identified potential noncompliance in the same city two years in a row, indicating that those cities did not make up in the second year for their noncompliance in the first year. In fact, the State Controller sent a notice of potential noncompliance to five cities for each year across four fiscal years, indicating continual noncompliance. For fiscal year 2020–21, the shortfall in local spending that the State Controller identified for these five cities was more than $1.6 million. However, the State Controller did not follow up on its reviews by conducting audits of any of these cities. As a result, it has not withheld any funds from cities that it suspects have not met the maintenance‑of‑effort requirement.
We determined that the six cities we reviewed recently met the maintenance-of-effort requirement. We reviewed the local expenditures that the cities reported to the State Controller for fiscal year 2020-21 to allow for further analysis if any did not meet the requirement in that year. Specifically, we reviewed accounting records to determine whether the cities reported local expenditures as required, and whether the level of that the spending was sufficient to meet the requirement.
The State Controller explained that it plans to conduct more reviews in 2024, and it agreed that conducting audits would be preferable to conducting reviews. The State Controller identified insufficient staffing as a significant challenge to its conducting audits for the Local Streets and Roads Program. In fiscal year 2018–19, the State Controller received funding for three permanent positions for conducting program reviews and four two‑year limited‑term positions that expired in June 2020 to conduct field audits. The State Controller reported that with these seven staff members, it was able to do all of the following: calculate the maintenance‑of‑effort amounts for each city and county, create road maintenance program guidelines specific to its oversight responsibilities, collaborate with the Commission on program implementation, perform desk reviews of the maintenance‑of‑effort requirement for 435 cities and 28 counties, and begin conducting field audits of 65 cities and counties potentially not meeting requirements. In January 2020, the State Controller submitted a request to make permanent the four limited‑term staff positions in order to continue the audits. However, staff explained that the State Controller withdrew this request due to the pandemic. The State Controller noted that it would need approximately six to eight additional staff members to enable it to conduct the audits, for a total of nine to 11 full‑time auditors compared to the three it has now.
State Law Does Not Provide Sufficient Time for Cities to Resolve Maintenance‑of‑Effort Issues
State law provides a limited window for cities and counties to make up shortfalls in meeting the maintenance‑of‑effort requirement: they must spend additional local funds in a second fiscal year after a first fiscal year in which they did not meet the requirement. If they do not make up the shortfall in that second fiscal year, state law allows the State Controller to withhold program funds. However, the process for the State Controller to receive data from the cities and counties and then determine whether they met the requirement takes many months. This means that by the time the State Controller has made its determination and notified the city or county of the shortfall, there remains only about a month for the city or county to increase its spending.
On or before December 1—five months into the fiscal year—the State Controller generally receives data on city and county spending from the most recently completed fiscal year, in part because cities and counties must close their accounting records after the June 30 end of the fiscal year. Prior to 2019, state law required cities and counties to provide this data in October, but the State revised the date to December that year, which provided cities with more time to submit accurate and complete reports. The State Controller begins reviewing this data to determine whether the cities and counties met the maintenance‑of‑effort requirement. The State Controller’s review of cities’ and counties’ compliance with the requirement for fiscal year 2021–22 took roughly six months to complete and comprised reviews for the more than 480 cities and 58 counties in the State. The State Controller’s activities during this time frame included sending notices of potential noncompliance to the cities and counties. However, when the State Controller sent the notices in the end of May 2023, there was just over one month remaining in the second fiscal year. As a result of this timing, the State Controller was asking cities to plan and approve additional spending in a very short period of time. For example, in the end of May 2023, the State Controller notified the city of Fontana of its potential noncompliance with the maintenance‑of‑effort requirement for fiscal year 2021–22 and specified that the city would need to spend approximately $256,000 in local funds on purposes related to streets and roads on or before June 30, 2023, to satisfy the requirement. The State Controller’s notice provided only a little more than one month for Fontana to spend a substantial amount from its discretionary funding sources before the end of the second fiscal year.
In general, cities need months to plan and approve additional spending for transportation. For example, in response to these notifications, cities would need to identify and secure a new funding source—such as by delaying another project and transferring those funds to a streets project—then develop a budget change proposal, get that proposal approved by the city council during a public meeting, and spend the additional funds. Cities indicated that completing these steps could take several months or more.
We did not identify concerns with the length of time it took the State Controller to review city and county spending and send the notifications because there is a large volume of data to review and the State Controller has limited staffing resources. In order to appropriately hold cities and counties accountable for not meeting the maintenance‑of‑effort requirement, we believe that they need an additional fiscal year after the State Controller completes its reviews to make up for insufficient local spending.
The State Controller’s Interpretation of State Law Reduces Its Likelihood of Holding Cities Accountable for Insufficient Local Spending
The State Controller has interpreted the law in a way that allows cities to continue to receive program funds even though some cities continually fail to meet the maintenance‑of‑effort requirement. According to the State Controller, as long as a city spends enough local funds to make up for the shortfall in a previous year, that city is complying with the program requirements and state law. The State Controller maintains this position even when cities continue to appear noncompliant with the maintenance‑of‑effort requirement year after year. For example, if a city has a maintenance‑of‑effort requirement of $1 million each year, but in Year 1 it only spent $700,000, the State Controller would identify the city as having incurred a shortfall of $300,000 in local spending on streets and roads. In Year 2, the city could spend $1 million, but the State Controller would count the first $300,000 as covering the prior year’s shortfall and would count the remaining $700,000 toward the city’s $1 million maintenance‑of‑effort requirement for Year 2. This means the city would still have a $300,000 shortfall, which would carry over into Year 3. In effect, the State Controller’s interpretation of the law allows this deficit to roll forward indefinitely, and the State Controller would not hold cities accountable for these shortfalls as long as the cities continued to spend some local funds on streets and roads. The State Controller noted that this practice of rolling shortfalls into the next fiscal year without withholding funds is how it conducted a different program, now defunct, that had similar statutory language related to maintaining local spending.
However, in the view of our legal staff, the State Controller’s interpretation of the law is contrary to its plain meaning. State law requires that the amount of local funding meet the maintenance‑of‑effort requirement over a two‑year period, to total the amount that the city or county should have spent during those two years. Whether the State Controller conducts reviews or audits, its staff has indicated that the standard used to determine whether a city or county has met its obligations for local spending on streets and roads is the rolling approach just described. In the above example, the State Controller should have withheld program funds from that city in Year 3 after conducting an audit, rather than allow the city to continue to receive full funding from the program.
Finally, the State Controller’s interpretation of state law’s ambiguity may lead to cities or counties losing their entire allocation, which we do not believe is an appropriate remedy for cities and counties that do not meet the maintenance-of-effort requirement. State law requires cities and counties to meet the requirement to remain eligible for the program, and allows the State Controller to withhold funds up to the amount they received from the program. The State Controller has interpreted the law to mean that it must withhold all program funds from cities and counties its audits find did not meet the maintenance of effort requirement. We consider this approach overly punitive, as the penalty for underspending local funds should be a withholding in the amount of that underspending and no more.
State Agencies Are Properly Administering Program Eligibility, Payment, and Reporting Processes
Key Points
- The Commission makes program information available to the public, has ensured that every city and county in the State is eligible to receive program funds, and has also ensured that cities and counties adopt projects in publicly held meetings.
- The State Controller accurately calculates allocations and distributes program funds to cities and counties.
- The Commission’s proactive approach to collecting spending information and making that information public ensures that all cities and counties report their program spending.
The Commission’s Program Eligibility Process Is Transparent and Complies With State Law
The Commission makes all program information, including information about eligibility for the program, available to the public in a manner that promotes transparency. To become eligible for program funding, cities and counties must be aware of submission deadlines in advance so they can develop project details and adopt authorizing resolutions at upcoming city council or board of supervisors meetings. The Commission created program‑reporting guidelines that include detailed explanations of the information that cities and counties must submit to demonstrate that they are eligible to receive funding. The Commission also publishes a three‑page funding eligibility checklist for cities and counties that itemizes these requirements. Instead of requiring cities and counties to draft resolutions without any guidance or direction, which may lead them to submit inadequate information, the Commission provides a sample resolution that cities and counties can consult for reference. Moreover, because cities and counties can submit project lists and expenditure reports for the program only through the Commission’s CalSMART database, the Commission provides guidance on how to use the database, holding multiple training sessions annually to provide city and county staff with step‑by‑step instructions. The Commission also publishes a guide for using CalSMART on its website. The six cities we reviewed—Baldwin Park, Bell, Coronado, Oakland, Riverside, and Yuba City—all indicated that they have not had any significant problems using CalSMART. Some city staff even stated that the analysts at the Commission are very responsive to their inquiries.
The Commission maintains a comprehensive list of contact information for all cities and counties and communicates directly with them to help ensure that they satisfy eligibility requirements and are aware of deadlines to submit information. Several months before it makes eligibility determinations, the Commission emails reminders to cities and counties to alert them of upcoming deadlines, providing them with ample time to submit the required information. For example, the Commission set a target of sending reminders in March to all cities and counties to remind them to submit their requests for funding, including eligibility information, by the July 1 due date. The Commission also has a process to send bi‑weekly reminders to governments at risk of missing the deadline inviting them to submit the information necessary for the Commission’s eligibility determination.
The Commission’s efforts are effective: Since 2019 every city and county in the State that is potentially eligible for the program has submitted information and received program funds.4 The Commission has achieved this success by offering to review draft resolutions, directly assisting cities and counties in preparing their project lists, and helping cities and counties correct any shortcomings in their submissions. The Commission tracks all submissions and keeps a record of any shortcomings that cities and counties must address to become eligible. For example, one city submitted its resolution without the signatures required to make the resolution official, so the Commission contacted the city to correct the issue. As Table 2 shows, of the 539 cities and counties that submitted information for fiscal year 2022–23, 201 needed corrective action. After the Commission worked with some of these cities and counties, only 14 cities had not provided complete submissions by the initial deadline and therefore needed to use the subsequent eligibility process. The Commission determined that these final 14 cities were eligible for program funding during that process. Our review of the submissions of 15 cities and five counties, which we selected based on the size of their populations, confirmed that they met all statutory requirements. We therefore conclude that the Commission has adequate processes in place for determining eligibility.
Further promoting transparency and accountability, the Commission ensures that cities and counties adopt projects in publicly held meetings that allow residents to review and comment on the city’s or county’s project proposals. The Commission clearly states this requirement in the program guidelines and the eligibility checklist and requires the cities and counties to submit through CalSMART resolutions adopted in public meetings. The Commission also stated that it performs a risk‑based review to verify that a selection of cities and counties adopted resolutions in public meetings. For example, when cities or counties submit unsigned resolutions, or use the process to obtain subsequent eligibility, the Commission stated that it reviews that government’s website to verify that the city or county adopted those resolutions in a public meeting. Our review of the 15 cities and five counties found that each did adopt their resolution containing the list of proposed projects in a public meeting.
The State Controller Accurately Distributes Program Funds to All Eligible Cities and Counties
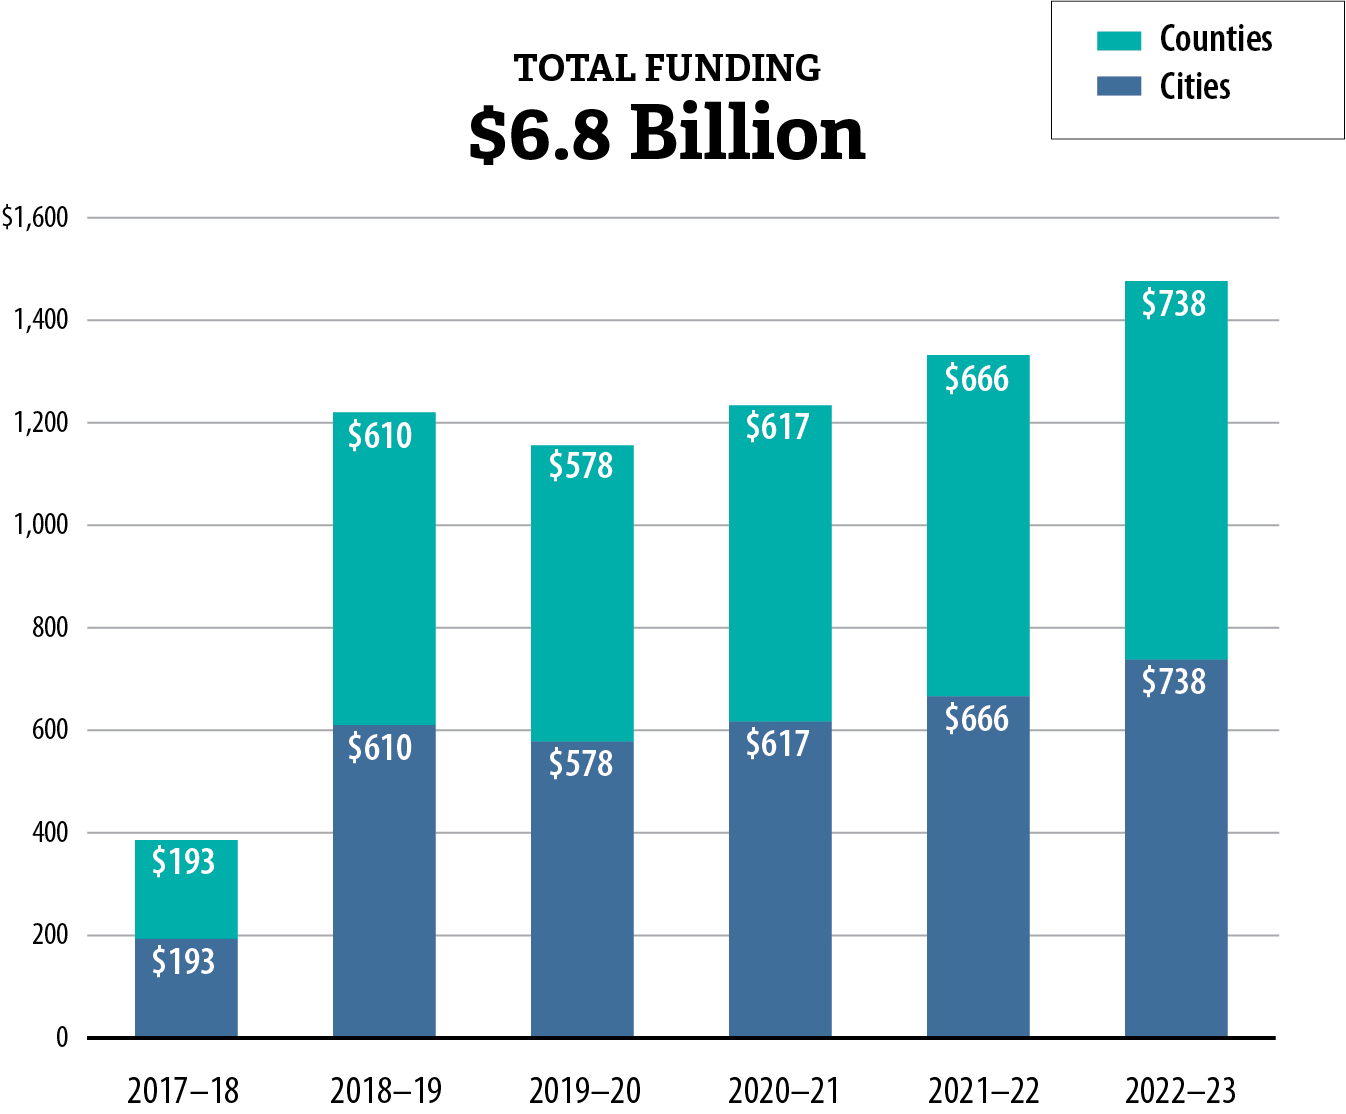
The State Controller has disbursed nearly $7 billion in program funds to cities and counties since the program began in 2017. As Figure 6 shows, the disbursement amount in fiscal year 2017–18 was the lowest because the State did not begin receiving revenue from the increased taxes and fees that fund the program until well into that fiscal year. The increase in fuel taxes did not begin until November 2017, and the transportation improvement fee began in January 2018. Since then, there has been little variation in the funding amounts from year to year, and the funding has generally increased.
Figure 6
Local Streets and Roads Program Funds Distributed to Cities and Counties Have Varied Slightly Each Year
(in millions)
Source: State Controller.
A bar chart from fiscal year 2017-18 to fiscal year 2022-23 with the funds distributed each year to cities and counties. The top shows the total funding of $6.8 billion. In fiscal year 2017-18 cities and counties each received $193 million. In fiscal year 2018-19 they each received $610 million. In fiscal year 2019-20 they each received $578 million. In 2020-21 they each received $617 million. In fiscal year 2021-22 they each received $666 million, and in fiscal year 2022-23 they each received $738 million. The overall trend is a significant increase after the initial year of the program, when revenues started collection, and more limited changes in subsequent years with an overall raise in distributed funds each year.
We calculated the appropriate distributions to cities and counties and found that the State Controller distributed funds to cities and counties in accordance with the formula specified in state law. We selected one month in each year of fiscal years 2020–21, 2021–22, and 2022–23 to verify, by recalculating, the State Controller’s payment amounts to each of the cities and counties. To recalculate the appropriate amounts, we obtained the calculation and supporting documentation that the State Controller used to derive the monthly payment amounts for each city and county. The supporting documentation included the various components of the calculation, such as the Commission’s report of eligible cities and counties, U.S. Census data, the Department of Finance’s certified population, the California Department of Motor Vehicles’ reports on registered vehicles, and the California Department of Transportation’s reports on maintained road miles. We used the Commission’s eligibility report to ensure that each of the cities and counties that the State Controller included in its calculations was eligible to receive program funds. We used the remaining documentation to identify key data necessary to independently calculate the monthly payment amount for each city and county, according to the requirements in state law. We found that the amounts our calculations produced agreed with those monthly payment amounts that the State Controller calculated and paid.
Further, to ensure that the cities actually received the correct amount of program funds, we verified that the six cities we selected for review received the amounts that the State Controller calculated. We collected the applicable accounting records at each of the six cities and compared the received amounts to the amounts that we calculated for the three months, and we determined that the State Controller appropriately provided the cities with all of the program funds.
As a point of clarification, we note that neither the State Controller nor the Commission is required to provide funding estimates or commitments to cities and counties. Because program funding comes from various fuel taxes and vehicle fees that can produce different amounts of revenue each month, the State Controller cannot guarantee a specific amount of funding. The six cities that we reviewed explained that they receive future funding availability estimates from the League of California Cities to inform their budgeting and project selection. The League of California Cities is a nonprofit advocacy group that supports cities and offers education and training programs for city officials. The League of California Cities also provides cities with estimates that it derives from the Department of Finance’s statewide revenue estimates contained in the Governor’s Budget proposals. The cities we reviewed stated that the funding amounts they anticipate receiving generally align with those amounts the State Controller ultimately provides.
Additionally, state law does not require cities to submit project cost estimates when submitting project proposals. As we discuss in the Introduction, the Commission, which oversees the process, does not approve proposed projects or authorize funding to specific projects. Rather, the Commission’s role is to review project lists and resolutions to ensure that they are complete and comply with statutory requirements. According to the Commission, cities and counties are responsible for determining which projects to fund and for determining how to fund them, based on their priorities each year. To fund and complete their planned projects, some of the cities we reviewed used multiple funding sources, such as grants or sales tax revenues, in conjunction with program funding.
The Commission Ensures That All Cities and Counties Submit Required Expenditure Reports
All cities and counties report their expenditures annually to the Commission. We found that each of the six cities we reviewed submitted expenditure reports as state law requires. We also verified that all cities and counties that received program funds reported their expenditures for fiscal year 2021–22, the most recent year available at the time of our review. To verify this, we obtained the expenditure reports from the Commission’s website and reviewed the data, comparing it to the State Controller’s data listing the cities and counties to which it distributed program funds. Later in this report, we discuss our work to verify the accuracy of the reports for the six cities we reviewed, which included reviewing accounting controls and tracing reported expenditures to source documentation such as invoices.
Program guidelines require cities and counties to use CalSMART to submit expenditure reports to the Commission by December 1 of each year. State law requires the expenditure reports to include specific information, as the text box shows, and states the intent of the law to provide transparency for the public and to promote accountability. The Commission collects and then publishes this information on its program website. We verified that the six cities we reviewed submitted their most recent expenditure reports in a timely manner.
Reporting Requirements for Program Spending
- Description of each project that used program funds.
- Location of each completed project.
- Amount of funds spent.
- Completion date.
- Estimated useful life.
Source: State law.
The Commission has developed an effective process to ensure that all recipients submit expenditure reports as required. The Commission publicizes program requirements and guidelines, including those related to expenditure reporting, and distributes them to cities and counties. It also conducts training sessions each year to provide local agencies with precise instructions on reporting their expenditures in CalSMART. The Commission provided documentation of attendance at its training sessions and documentation of its efforts to keep cities and counties informed. We reviewed the content of these training sessions and found that they provide extensive and detailed information necessary for cities and counties to submit reports effectively.
Further, the Commission tracks the reports it receives and identifies which cities and counties have not submitted reports. We confirmed that as the deadline approaches, the Commission contacts those cities and counties that have not yet submitted required information. The Commission then works directly with those cities and counties to ensure that they report the information on time. Because of this proactive approach to ensure timely reporting, the Commission has not needed to take further actions to address any lack of reporting.
Although the Cities We Reviewed Are Appropriately Using Local Streets and Roads Program Funding, Most Still Have Deteriorating Road Conditions
Key Points
- The cities we reviewed are using program funds as intended by improving poor street conditions. Some cities direct their spending to disadvantaged communities. All six cities promote transparency and accountability and conduct community outreach.
- Despite the State’s significant investment through the program, street conditions in these cities continue to decline, in part, because of inadequate financial resources.
The Cities We Reviewed Generally Use Program Funding to Address Streets With Poor Pavement Conditions
Cities use different processes for selecting projects but generally use Local Streets and Roads Program funding to improve those roads with deteriorated pavement conditions. The six cities we reviewed each use a pavement management system to assess and address the needs of their local streets. A typical pavement management system uses computer software, informed by onsite reviews of actual pavement conditions, that provides PCI data for road segments and the road network over a period of time. Cities use this information to assess both their current and anticipated future pavement conditions and to identify maintenance and rehabilitation recommendations that optimize the use of available funding. This assessment allows cities to identify the streets with the poorest conditions when selecting projects to fund through the program.
In the past, some cities did not prioritize repairs for the streets with the poorest conditions, indicating a potential lack of consideration for the equity of their investments in street repair and maintenance. Some cities fund projects that are located in areas designated by the State as disadvantaged communities. Historically, cities may not have always focused funding on the streets in the poorest condition, either because of a lack of funding or because of a pavement management system that did not consider equity across different areas of the city. As a result, projects that cities are currently prioritizing can be located in areas that they have historically neglected. For the six cities we reviewed, we evaluated each city’s process for selecting projects, and we reviewed those projects to verify that each city prioritized streets according to its established priorities. Using the pavement management system reports, we verified the condition of the streets selected for maintenance or other improvements. In Figures A.1 through A.6 of the Appendix, we provide the location of most of the projects in relation to disadvantaged communities in the cities that we reviewed.
State law provides cities and counties with some flexibility in their use of program funds, allowing them to adapt the program to meet local needs. Cities may use program funds in combination with state or federal grants, and some cities have been able to do so to repair more streets in poor condition and to address multiple objectives, which they could not do using only program funds. For example, Yuba City reserved nearly $1 million in program funds to match $4.3 million in state and federal grants to begin an approximately $5.2 million project to repair pavement and construct such complete street elements as bike lanes and sidewalks. To facilitate funding for another project, Yuba City accumulated program funds over several years as allowed by state law.
State law also allows cities and counties to fund projects they had not included in their proposed project lists. For example, in 2021 the city of Davis proposed to use program funds to install and repair curb ramps, bike lanes, and other complete street projects throughout the city. However, Davis deferred some of this work as part of a larger project and instead chose to use program funds for a road rehabilitation project. Some of the cities we reviewed expressed their gratitude that the program allows such flexibility in the use of funding.
We also evaluated the extent to which cities considered equity in their selection of projects to fund. Importantly, state law neither defines equity nor requires cities to consider equity during the project selection process for the program. Nonetheless, Oakland’s department of transportation has developed a weighting system that accounts for both street conditions and underserved populations, as shown in Table 3. Oakland uses planning areas that follow Oakland’s geography and demographics—which do not align with its city council districts—as a simple way to distribute resources equitably. To include the underserved population component of the weighting system, city staff identify the percentage of Oakland’s underserved population that reside in each planning area. Staff use U.S. Census data to quantify the underserved populations, such as the percentage of households with low incomes or having residents who are people of color. Oakland then identifies the percentage of each planning area’s streets that are in poor condition. The city combines the underserved population and pavement condition components to produce weighting factors for each planning area. Oakland then distributes program funding by planning area using the weighting factors.
Riverside stated that it, too, addresses equity in its project selection decisions. In addition to consulting its pavement management report when selecting projects, the city also considers whether projects address public maintenance requests and community concerns. The city is divided into wards and the staff targets streets for repair to ensure that the city distributes funds evenly among those different areas of the city, particularly when addressing maintenance requests. This approach ensures that no one area will receive more funding just because people in that area have submitted more maintenance requests. Riverside also uses Community Development Block Grant funds for some projects; federal regulations require that those funds be used to target low‑income residents and that regular community meetings be held to address potential concerns.
We also evaluated each city’s efforts to promote transparency and accountability and found that the cities all met or exceeded state law’s requirement that cities adopt proposed projects in publicly held meetings. The cities we reviewed complied with those requirements and also held community meetings to encourage public engagement or publicized information about projects using government websites or social media. Oakland held community meetings in different languages when it reviewed its paving plan with residents, and Coronado developed a website to provide public updates on its sidewalk enhancement project. Moreover, each of the six cities, or the hired contractors, sends notifications of planned construction projects to affected community members. Cities typically require staff to present larger projects at city council meetings that are open to the public. Thus, if cities need to change projects after submitting their proposals to the Commission, the public likely has an opportunity to comment at those meetings. Cities are also required to provide updates on projects when they submit their expenditure reports to the Commission and are required to inform the Commission of any changes to their list of proposed projects. Each of these efforts to involve the public provides opportunity for transparency and accountability and provides communities with critical information about changes to their local streets.
The Six Cities Commonly and Appropriately Use Program Funding for Maintenance and Rehabilitation Projects
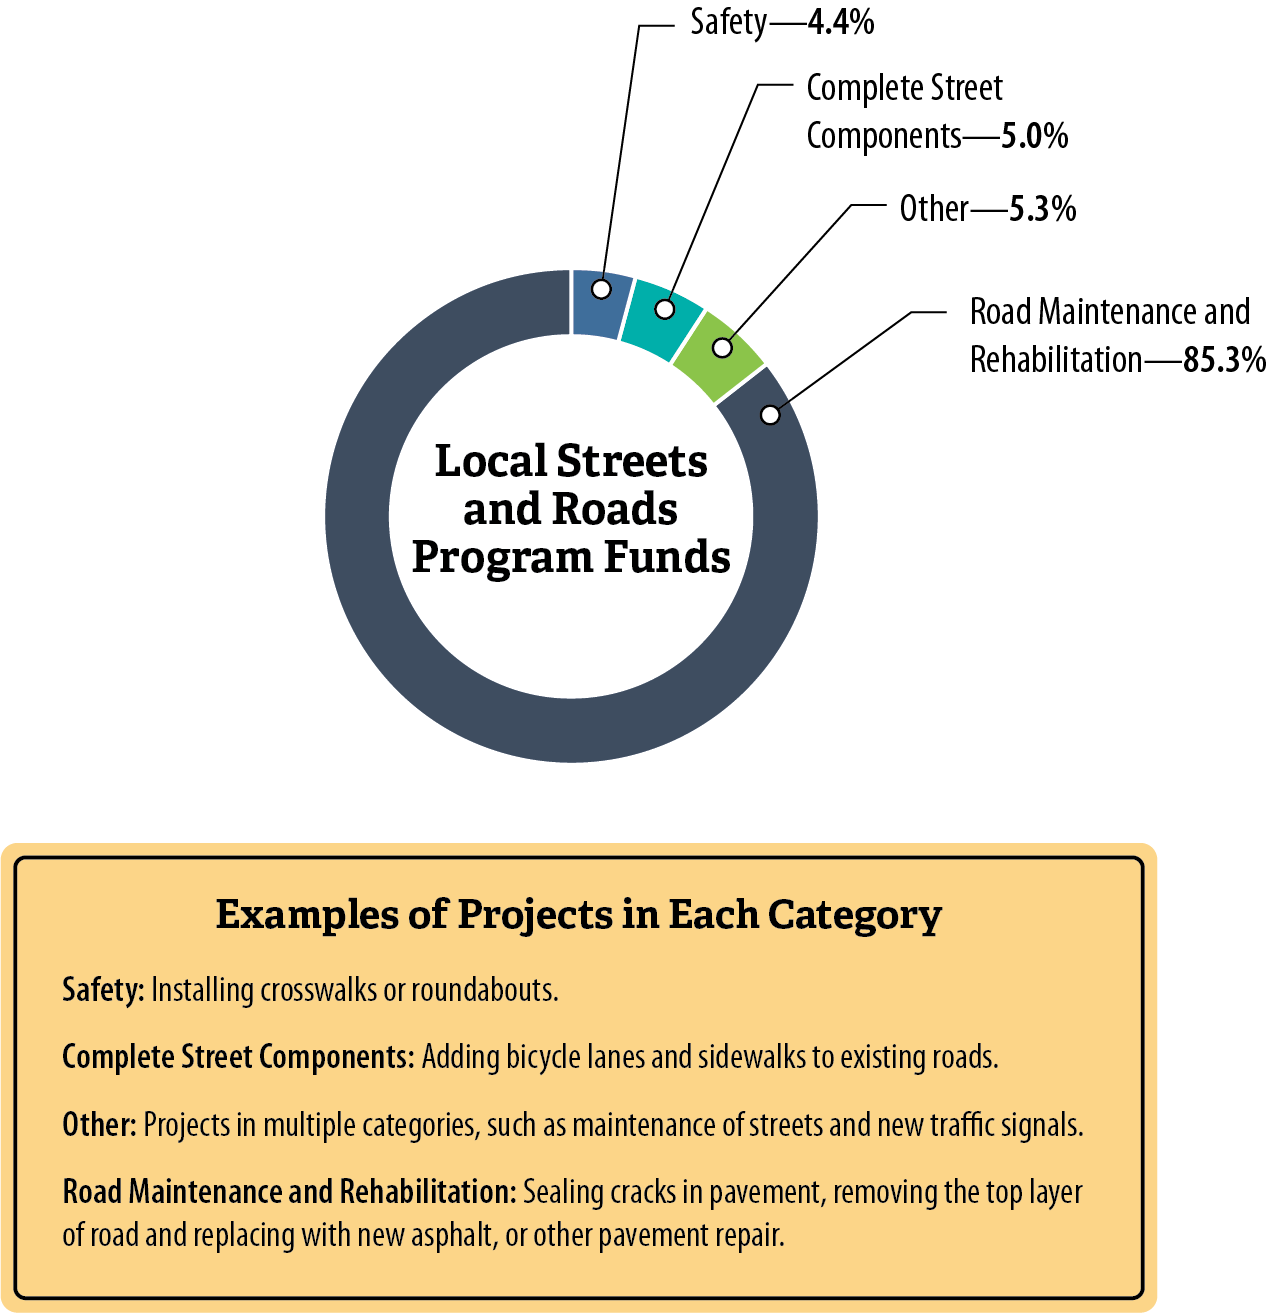
We reviewed expenditure data that all cities and counties submitted to the Commission to identify the most and least common uses of program funds. We found that cities and counties reported spending 85 percent of total program funds on road maintenance and rehabilitation, as Figure 7 shows. Similarly, we found that five of the six cities we reviewed spent the majority of their program funds on road maintenance and rehabilitation. We provide a detailed breakdown of their spending in Appendix Table A.3, which shows that the six cities in total spent the majority, or 72 percent, of their program funds on road maintenance and rehabilitation.
Figure 7
Cities and Counties Spent the Majority of Local Streets and Roads Program Funds on Road Maintenance and Rehabilitation From Fiscal Year 2017–18 Through 2021–22
Source: Commission expenditure data for all cities and counties.
Figure 7 is a pie chart that shows the proportion of program funds that have been spent in four different expenditure categories from fiscal year 2017-18 through 2021-22. The four categories are Safety, Complete Street Components, Other, and Road Maintenance and Rehabilitation, which are described below the pie chart. Cities have spent the majority of funds on road maintenance and rehabilitation projects, which account for 85.3% of funds spent. Projects in the ‘other’ category, which represents projects that are in multiple categories, accounts for 5.3% of funds spent. 5% of spending was for complete street components and 4.4% was for safety projects.
The six cities used the remaining program funds for other allowed purposes, such as road safety projects. For example, Oakland spent some program funds on a traffic‑calming program, which included adding speed bumps and improving crosswalks on city streets. Coronado used all of its program funds on a complete street components project that created more space and better visibility for pedestrians on an oceanfront boulevard. In this respect, Coronado is unique among the cities we reviewed, because its use of program funds has not focused on street rehabilitation and maintenance. In 2022 Coronado had an overall PCI of 75, which is good and much higher than the statewide average. Because its pavement conditions are generally good, it has fewer maintenance needs and can prioritize other types of projects. Under state law, these are all allowable uses of funds.
After reviewing a selection of expenditures, we found that each of the cities we reviewed used program funds appropriately. We obtained accounting reports that listed each of the project expenditures from fiscal years 2019–20 through 2021–22, and we ensured that they reconciled to the expenditure amounts that the cities reported to the Commission. We then reviewed underlying documentation at each city, such as invoices and staff time charges, to determine how cities used these funds. For each city, we reviewed supporting documents from a selection of projects listed in the expenditure report, which enabled us to review approximately 50 percent or more of each city’s program spending. We found that the cities we reviewed spent all funds on allowable uses, including projects that improved road conditions or added safety elements. We found no evidence that cities used funds inappropriately, such as for police or fire services.
Further, the six cities have processes and systems in place to ensure that they spend program funds appropriately. Our testing included examining the processes that cities use to ensure that they spend funds appropriately. For example, we found that each city has a separate fund to track program revenues and expenditures, which ensures that the city does not combine program funding with other funding sources or misappropriate funds. We also reviewed purchasing and accounting controls that restrict how city staff can spend program funds. For example, Oakland has a gasoline tax road maintenance and rehabilitation account that its transportation department uses to track program funds and ensure that the city spends those funds only on allowed activities. The city also limits who can spend funds from this account to ensure that only relevant departments may access funds, such as its Department of Transportation.
Streets Are Deteriorating Faster Than These Cities Can Improve Them With Available Program Funds
We found that for the six cities we reviewed, pavement conditions have declined by 10 percent—from an average PCI of 69 in 2015 to an average PCI of 62 in 2022. At the time it passed SB1, the Legislature found that cities and counties faced a $78 billion funding shortfall for adequately maintaining existing streets over the next decade. In the first six years of the program, from fiscal years 2017–18 through 2022–23, the State provided cities and counties with a total of nearly $7 billion—just a fraction of the shortfall they faced in 2017. The six cities we reviewed reported that the program funding they do receive is often not nearly the amount they need to maintain or improve their street conditions. As Table 4 shows, the cities’ annual spending for this purpose is significantly lower than the amount they estimate is needed to improve their road conditions. For example, in 2022 Riverside reported that it spent $21 million on maintenance and improvements to its roads annually, but it estimates that it would need to spend $40 million each year to maintain its current road conditions and $98 million each year to improve its road conditions to a PCI of 70 within five years.
The cities reported that program funding is critical to their ability to mitigate the rate of deterioration on their streets. As Figure 8 shows, the overall PCI for the six cities that we reviewed has generally declined since 2015, and some cities’ pavement conditions are approaching “Poor” condition. For example, Yuba City’s overall pavement network had an average PCI of 53 in 2022, meaning that the streets are in the “At Risk” category and potentially in need of a new road surface, also called resurfacing. For context, Yuba City receives approximately $1.4 million in program funds each year to assist it in maintaining approximately 525 lane miles of pavement. However, this amount falls far short of the nearly $13 million it estimates it needs annually to maintain the condition of its streets and is drastically less than the $21 million needed to improve its streets. The 2023 pavement assessment report indicated that Yuba City needs to spend $258 million over the next 10 years to bring its street network to a condition that can be maintained with ongoing preventive maintenance.
Figure 8
Pavement Conditions in the Cities We Reviewed Have Generally Declined Since 2015
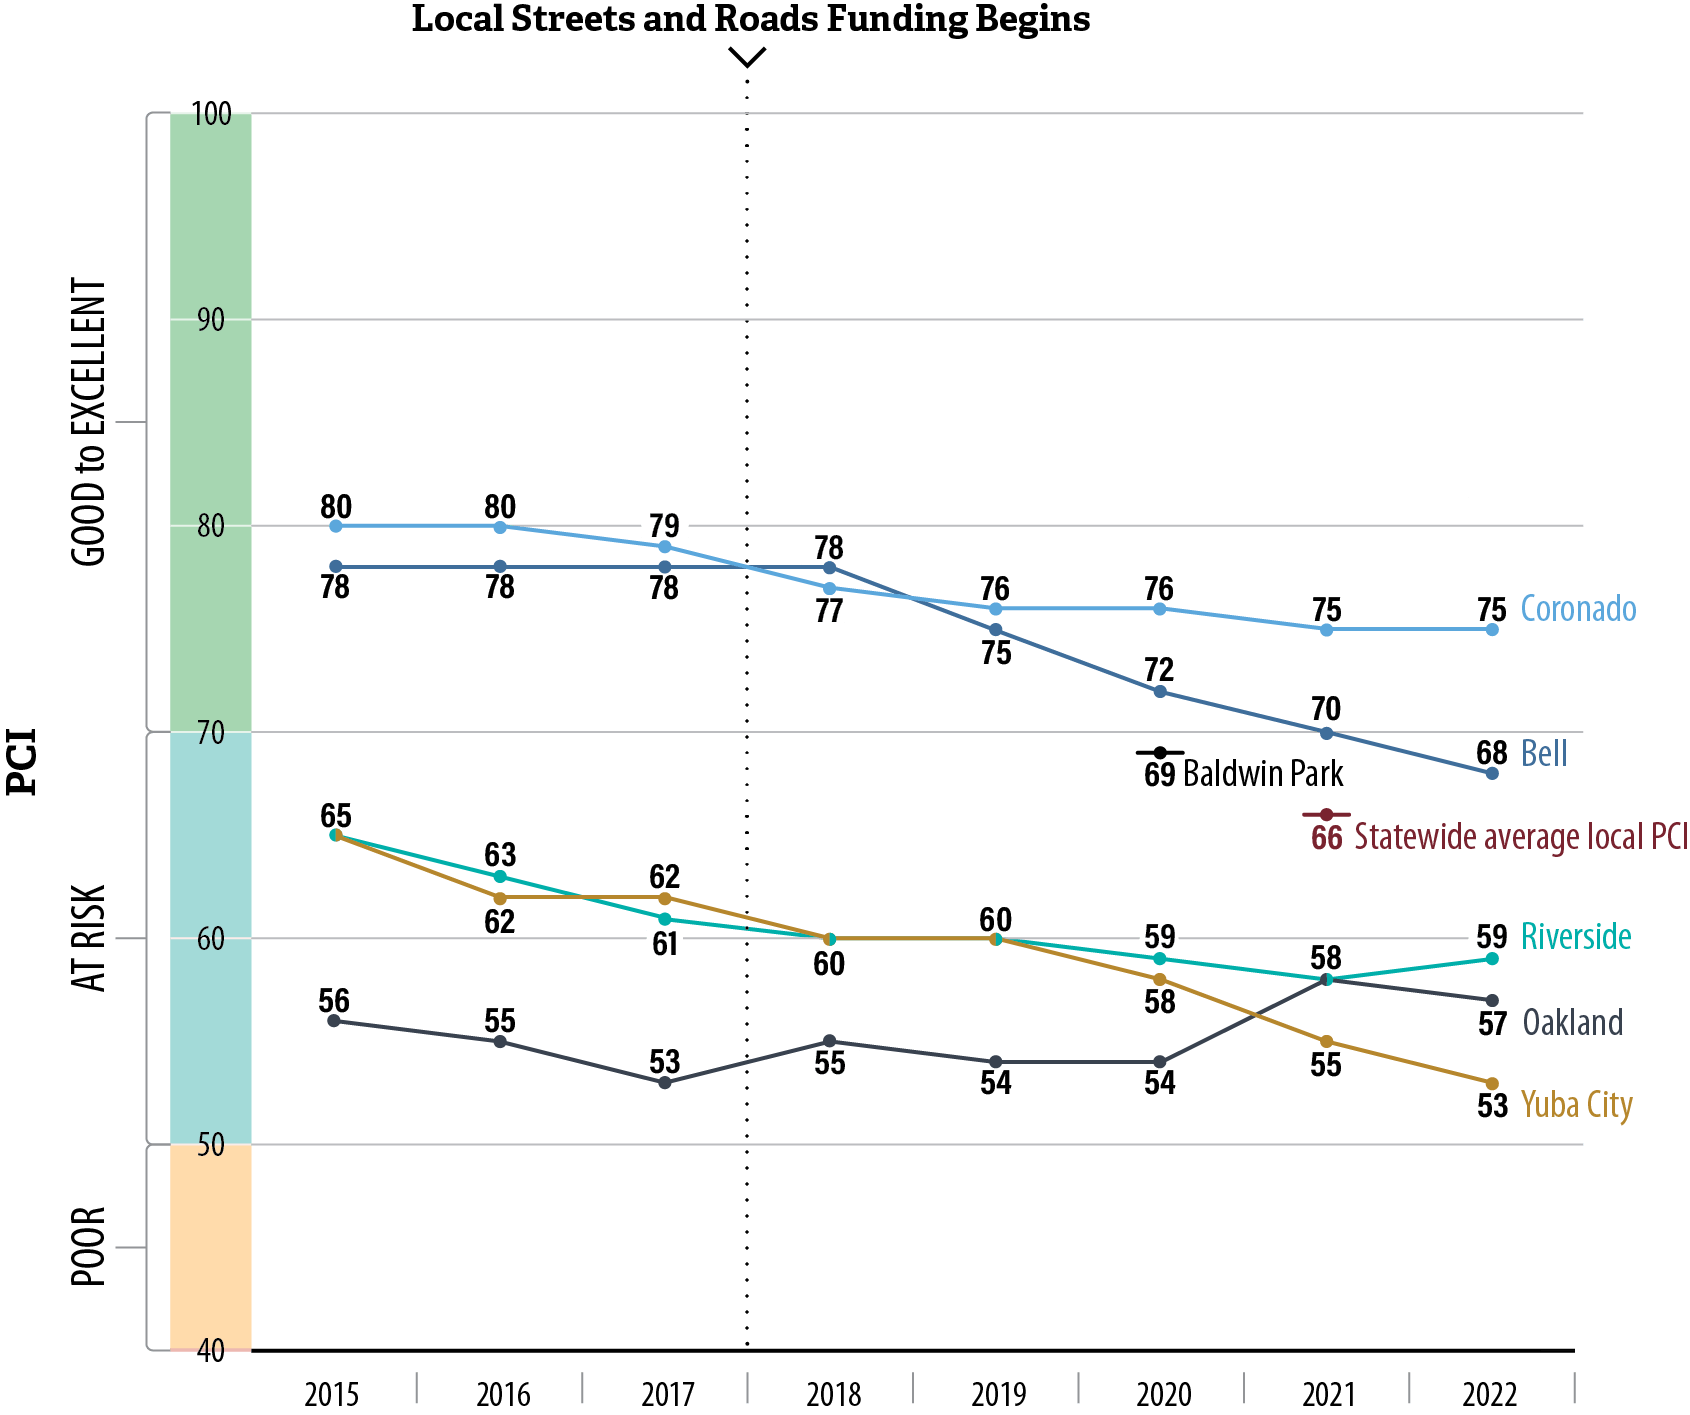
Source: City pavement management system reports, staff estimates, and California Statewide Local Streets and Roads Needs Assessment.
Note: Baldwin Park used a pavement management system prior to 2020 but does not have confidence in its accuracy. Therefore, we do not include that information. The city plans to update its PCI information in 2024 but does not have values for 2021, 2022, or 2023.
Figure 8 is a chart that shows the decline in pavement condition for the five of the six cities we reviewed. The y-axis the average PCI, with a range from 40 – 100 and is divided into different shaded areas that describe the pavement condition within that range. 40 – 50 is labeled poor. 50 – 70 is labeled at risk. 70 – 100 is labeled good. The x-axis has evenly spaced segments for each year, starting at 2015 and ending at 2022. At the beginning of 2018, there is a dotted line that indicates when Local Streets and Roads Funding began. This graph shows the pavement condition for each city for each using points on the graph with numerical values. Each city’s points are connected by different color lines. Almost all cities show a decline in pavement condition over these years, with slight increases and decreases throughout that time period. Oakland is the only city that has increased its rating substantively. Oakland’s pavement condition was 56, or at risk, in 2015. In 2021, its pavement condition had risen to 58. Baldwin Park did not have confidence in the accuracy of its rating prior to 2020, or in 2021 or 2022. Therefore, we do not include that information. Bell’s pavement condition was 78 in 2015, which is good. In 2022 its pavement condition was 69 or at risk. Coronado’s pavement condition was 80 in 2015 and 75 in 2022, which are both within the range considered good. Riverside’s pavement condition was 65 in 2015 and 59 in 2022, which are both at risk ratings. Yuba City’s pavement condition was 65 in 2015 and decreased to 53 by 2022. Both ratings are at risk.
Additionally, although Coronado’s 166 lane miles of pavement is in the best condition of all six cities’ pavement, its PCI has slowly declined since 2015, decreasing from 80 to 75, although the streets are still in the “Good‑to‑Excellent” category in 2022. Coronado is currently completing a review of its pavement condition to determine how much funding it will need to maintain the condition of its pavement and provided us with an estimate. Of the six cities, Oakland, which has 2,052 lane miles of pavement, is the only city to have slightly increased its PCI since 2015. In 2015 Oakland had a PCI of 56, which declined to 53 in 2017 before the State began providing program funding. However, from 2018 to 2022, after the city began receiving this funding along with more than $350 million in revenues it authorized from a bond measure, Oakland increased its overall PCI from 55 to 57. Nonetheless, this PCI indicates that Oakland’s average pavement condition is still categorized as “At Risk” and in need of resurfacing.
Many cities struggle to maintain their current PCI, and some have identified additional resources to address the poor condition of their streets. The roads in Coronado and Bell have generally been in good condition, although they have declined in recent years, and they have not yet needed to identify additional funding sources. The four other cities we reviewed—Baldwin Park, Oakland, Riverside, and Yuba City—do not have good pavement conditions.
In light of these conditions, these four cities have identified and used additional funding sources, such as sales taxes and bonds, for street repair and maintenance, or they are considering doing so in the future. For example, Oakland passed a bond measure in 2016 to, among other things, fund rehabilitation and maintenance of its streets, and it combines these bond measure funds, an authorized total of $350 million, with funds from the Local Streets and Roads Program. Riverside stated that it receives around $2.4 million a year from a countywide transportation sales tax revenue specifically dedicated to maintaining the city’s streets. Baldwin Park, according to a city official, receives $1.6 million annually in funding for streets from three bond measures: a Los Angeles County measure from 1990 and two other bond measures from 2008 and 2016. Yuba City has not yet passed a tax or bond measure to fund street repair. In light of its funding challenges, Yuba City is currently evaluating whether to place a measure on the November 2024 election ballot to increase sales taxes by 1 percent to collect $14.5 million each year. As a general tax increase, the city cannot restrict itself to using this funding on its streets. However, it can use this funding on general government activities, such as public safety, infrastructure projects, and deferred maintenance, which can include maintenance of its streets. Despite the additional funding from the program, cities will continue to struggle to maintain the conditions of their streets.
Recommendations
The following are the recommendations we made as a result of our audit. Descriptions of the findings and conclusions that led to these recommendations are available in the sections of this report.
Legislature
To allow cities and counties that do not meet the maintenance‑of‑effort requirement enough time to plan and budget for additional local spending on streets and roads projects, the Legislature should amend state law to allow cities and counties two fiscal years, instead of one, to make up their shortfalls.
To ensure that cities and counties are appropriately held accountable to the maintenance‑of‑effort requirement, the Legislature should amend state law to clarify that the State Controller should only withhold an amount of program funds equivalent to the local underspending that its audits have found.
State Controller
To ensure that it holds cities and counties accountable to state law and that they are not supplanting local spending with program funds, by October 2024, the State Controller should begin auditing cities and counties that it identifies as at risk of not meeting the maintenance‑of‑effort requirement. It should withhold program funds in the amount prescribed by law from cities and counties that it concludes have not complied with the requirement.
To ensure that it holds cities and counties accountable to state law and that they are not continuing to supplant local spending with program funds, the State Controller should by October 2024 revise its practice to only allow cities or counties to violate the requirement for two fiscal years, rather than continually, as under its current practice. After two years’ noncompliance, the State Controller should withhold program funds in accordance with state law.
Other Areas We Reviewed
The Joint Legislative Audit Committee (Audit Committee) requested that we determine whether state entities provided flexibility to cities and counties on the use of streets and roads program funding during the pandemic, the extent of any actions taken, and whether these state entities are still providing such flexibility. To address this objective, we reviewed actions taken by the State Controller and the Commission, and we assessed whether the pandemic affected any of the selected six cities’ administration of program funds.
State Entities Moved Program Deadlines in Response to the Pandemic
The Commission adjusted program deadlines during the pandemic in response to concerns from cities and counties. In spring of 2020, near the beginning of the Statewide Emergency and stay‑at‑home order, cities and counties would have normally submitted information to the Commission to become eligible for program funding. However, the Commission explained that it performed outreach to cities and counties and received prevailing feedback that they would find it difficult to meet these program deadlines. To account for potential delays caused by the stay‑at‑home order, the Commission moved its deadline for receiving the submissions from May 1, 2020, to July 15, 2020. The Commission also extended the due date for submitting expenditure reports from October 1, 2020, to December 1, 2020. In March 2021, the Commission adopted the extended due dates on an ongoing basis by shifting the submission deadline to July 1 and the expenditure‑reporting deadline to December 1. The Commission explained that it developed these changes in consultation with cities, counties, the State Controller, and other transportation stakeholders, and that stakeholders believed the new schedule to better align with annual budget adoption and financial reporting. The six cities we interviewed indicated that the Commission provided them with sufficient support to manage pandemic‑related challenges, including by changing its submission and expenditure‑reporting deadlines.
Six Cities We Reviewed Faced Varying Challenges and Made Adjustments to Respond to the Pandemic
Four of the six cities we reviewed—Bell, Coronado, Oakland, and Yuba City—indicated that the pandemic ultimately presented minimal or no barriers to completing their planned projects. For example, although Oakland reported a decrease in sales tax revenue because of the pandemic, the federal aid it received was sufficient to cover the city’s shortfall, so Oakland did not need to make funding cuts to its streets and roads program projects. Coronado explained that although it faced some delays for reasons that included staff illness and turnover, the delays were minor and the city was able to complete its one project underway at the time within the anticipated schedule. Bell stated that it experienced no delays in constructing or designing projects, whereas Yuba City explained that supply‑chain issues resulting from the pandemic caused its one project about a one‑month delay.
We conducted this performance audit in accordance with generally accepted government auditing standards and under the authority vested in the California State Auditor by Government Code section 8543 et seq. Those standards require that we plan and perform the audit to obtain sufficient, appropriate evidence to provide a reasonable basis for our findings and conclusions based on the audit objectives. We believe that the evidence obtained provides a reasonable basis for our findings and conclusions based on our audit objectives.
In contrast, the other two cities we reviewed—Baldwin Park and Riverside—described experiencing delays and challenges in completing their projects. For instance, Baldwin Park noted that the two biggest impacts were shortages in labor and materials and that supply‑chain issues made it difficult to obtain essential electrical equipment for traffic signal and streetlight projects. Riverside also noted difficulty because of inflation and supply‑chain disruptions and explained that the city adjusted by choosing to fund less expensive projects.
We conducted this performance audit in accordance with generally accepted government auditing standards and under the authority vested in the California State Auditor by Government Code section 8543 et seq. Those standards require that we plan and perform the audit to obtain sufficient, appropriate evidence to provide a reasonable basis for our findings and conclusions based on the audit objectives. We believe that the evidence obtained provides a reasonable basis for our findings and conclusions based on our audit objectives.
Respectfully submitted,
GRANT PARKS
California State Auditor
April 4, 2024
Staff:
Laura G. Kearney, Deputy State Auditor
Jim Adams, Senior Auditor
Michael Henson
Kent Casimir
Kyler Campion
Legal Counsel:
Rick Weisberg
Appendices
Appendix A—Selected Program Information
Appendix B—Scope and Methodology
Appendix A
Selected Program Information
City and County Program Allocations
The State Controller distributes funding to eligible cities and counties throughout the State. To do so, it uses information on the number of registered vehicles and road miles in counties and census data on the population in cities. Specifically, the State Controller must proportionally distribute the funds available to cities according to each city’s proportion of the population of all cities in the State. For example, if a city has 1 percent of the total population of all cities in the State, the State Controller would distribute 1 percent of available funds to that city. For counties, the State Controller must distribute three‑quarters of the funding according to each county’s proportion of all registered vehicles in the State. The law then requires the State Controller to proportionally distribute the remaining quarter of county funding to each county according to the number of miles of maintained county roads in each county in proportion to all miles of maintained county roads in the State. Tables A.1 and A.2 list the program funds that the State Controller allocated to cities and counties for fiscal year 2022–23, along with applicable information on the number of registered vehicles, road miles, and population data.
Project Details for the Six Cities We Reviewed
The six cities we reviewed generally spent program funds on road maintenance and rehabilitation projects, as Table A.3 shows. These rehabilitation projects include sealing cracks in pavement and replacing the top layer of roads with new asphalt. Cities that used program funds to fund complete street projects undertook projects such as adding bike lanes and sidewalks to existing roads. Table A.4 provides additional detail about the specific projects that these six cities funded. Many of these projects are located in disadvantaged communities.
The California Environmental Protection Agency (CalEPA) identifies disadvantaged communities according to geographic, socioeconomic, public health and environmental hazard criteria. CalEPA’s Office of Environmental Health Hazard Assessment provides online maps that display these disadvantaged communities. The cities we reviewed typically fund projects to address streets with the poorest road conditions, and some cities explicitly direct funding to improve streets in disadvantaged communities. Figures A.1 through A.6 show the locations of major street projects in relation to the disadvantaged communities identified by CalEPA in each of the cities we reviewed. These figures generally include projects that cities reported funding from fiscal years 2017–18 through 2021–22.
Figure A.1
All Local Streets and Roads Program Projects in Baldwin Park Have Been Located in Disadvantaged Communities
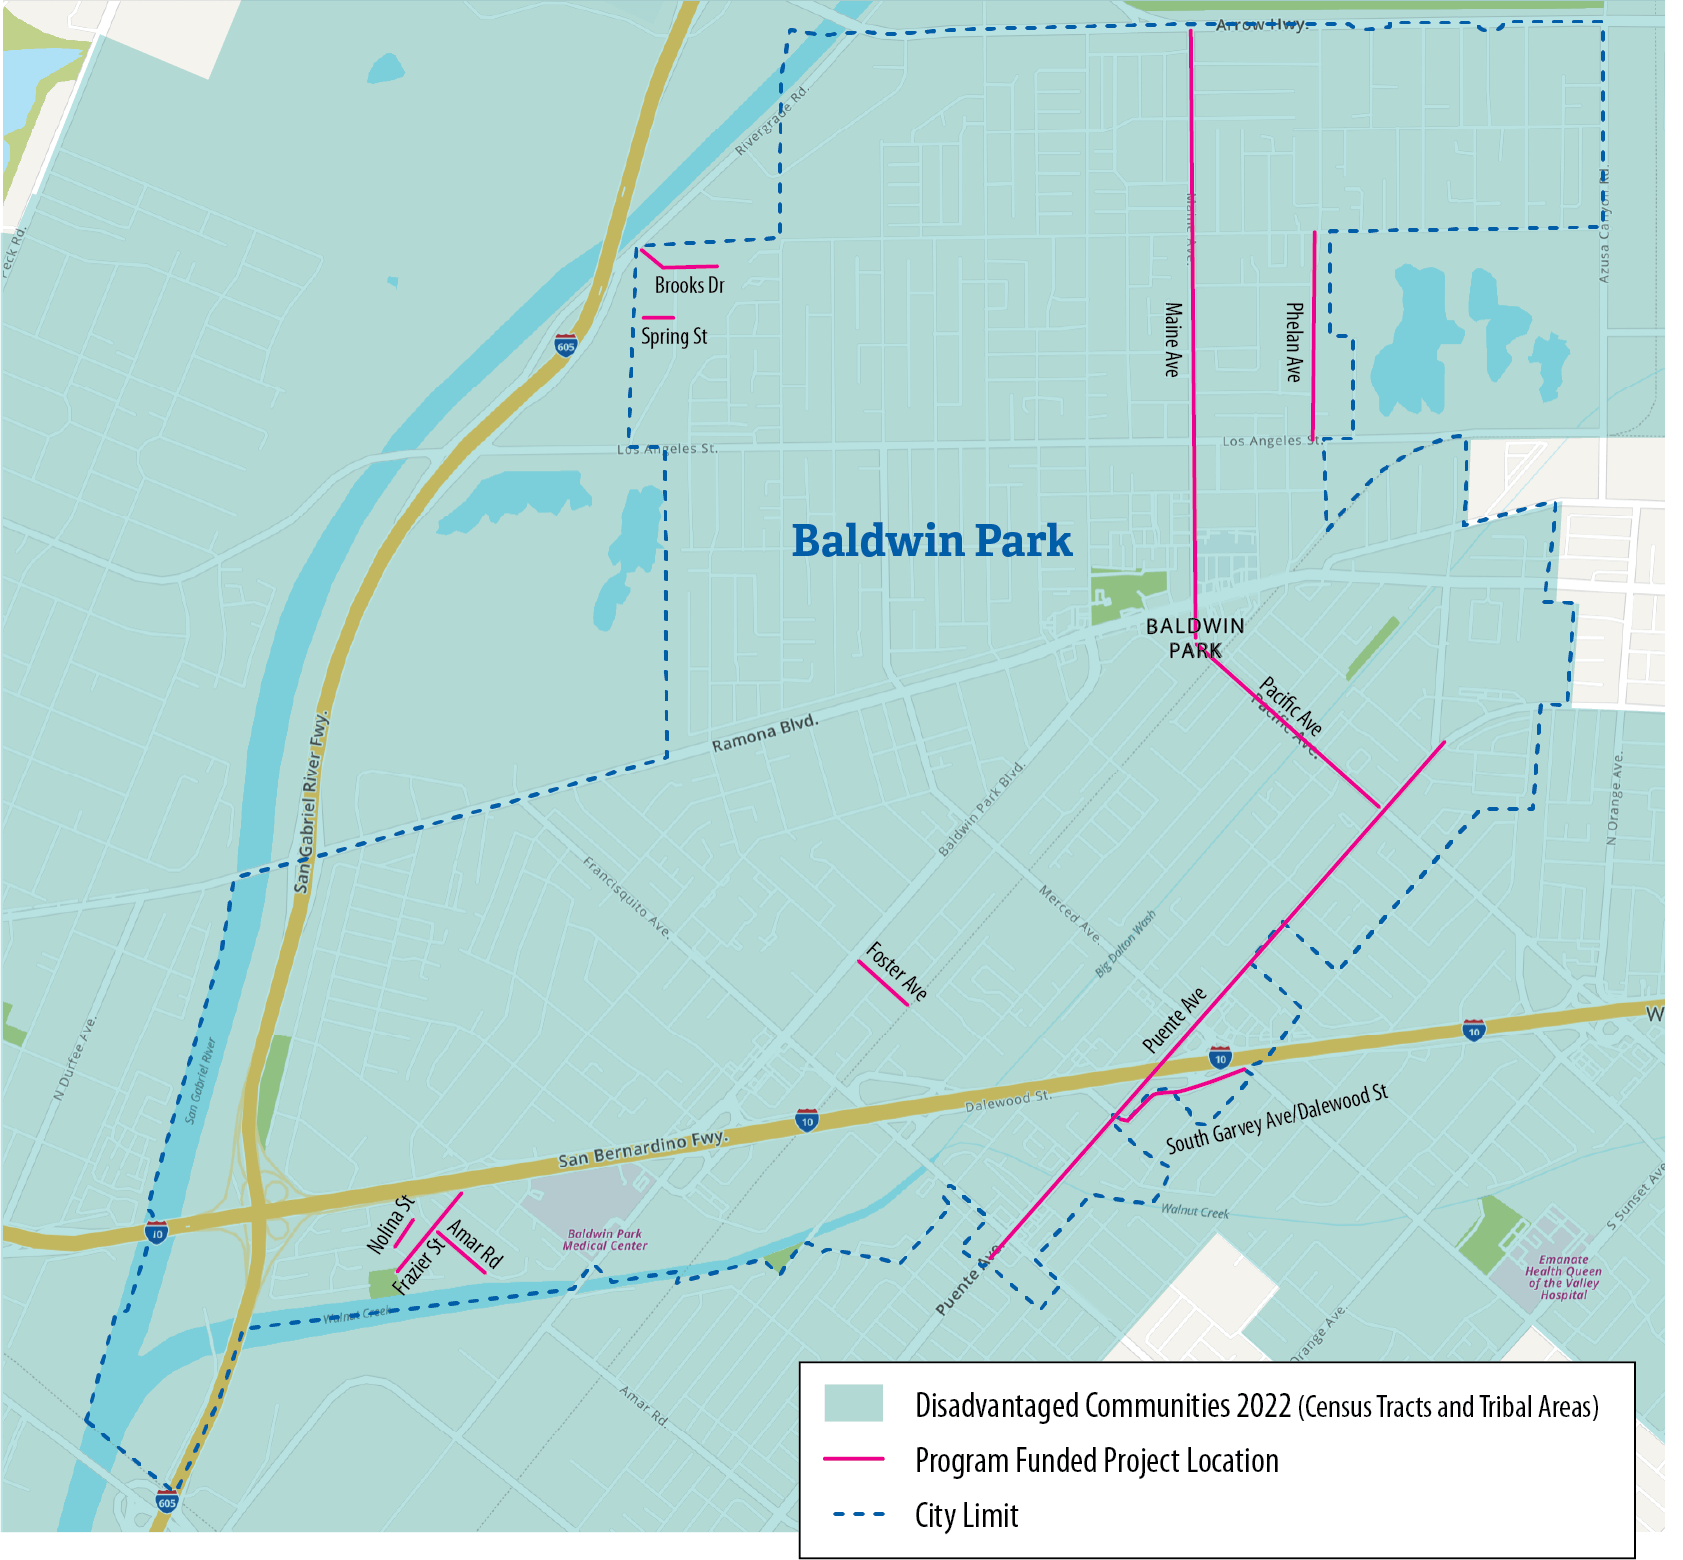
Source: The Office of Environmental Health Hazard Assessment and Baldwin Park reporting to the Commission for fiscal years 2017–18 through 2021–22.
Note: This map does not include some smaller street segments that the city reported paving or streets the city reported paving but for which the beginning and ending locations were not in the public data.
Figure A.1 is a map of Baldwin Park with a blue dotted outlining the city limit. The entire city is shaded light green, which indicates that the entire City is located within a designated disadvantaged community. Red lines indicate the location of program funded projects. These projects are generally on the periphery of the city, but there are prominent projects in the center of the city on Maine and Pacific avenues. Because the entire city is a disadvantaged community, all projects are located within a disadvantaged community.
Figure A.2
All Local Streets and Roads Program Projects in Bell Have Been Located in Disadvantaged Communities
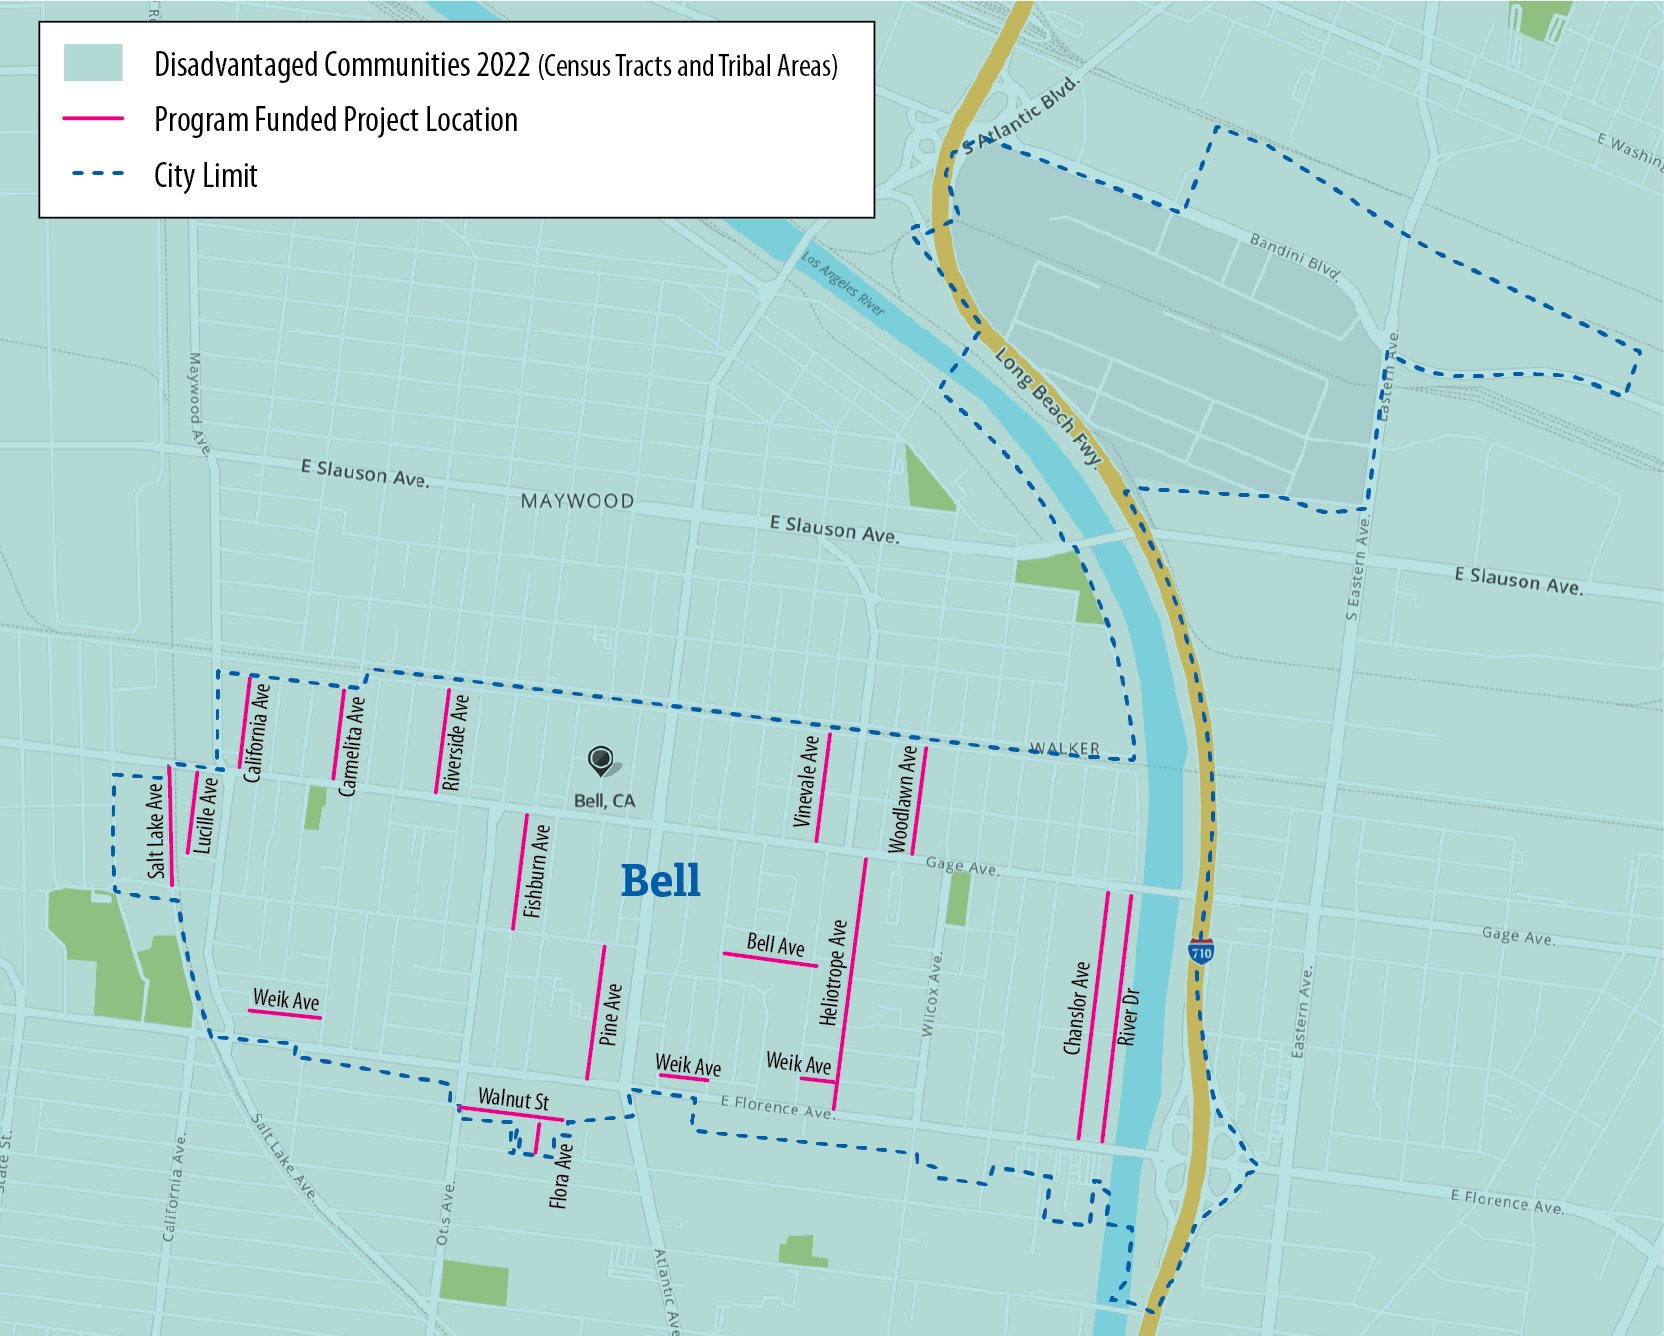
Source: The Office of Environmental Health Hazard Assessment and Bell reporting to the Commission for fiscal years 2017–18 through 2021–22.
Note: This map does not include some smaller street segments that the city reported paving.
Figure A.2 is a map of the city of Bell with a blue dotted line outlining the city limit. The entire map is shaded light green, which means that the entire City is a designated disadvantaged community. There are red lines that indicate the location of program funded projects. These projects generally were on north-south streets throughout the small city. Because the entire City is a disadvantaged community, all projects are located within disadvantaged communities.
Figure A.3
Coronado’s Local Streets and Roads Program Project Was Not Located in a Disadvantaged Community Because the City Does Not Have Any Disadvantaged Communities
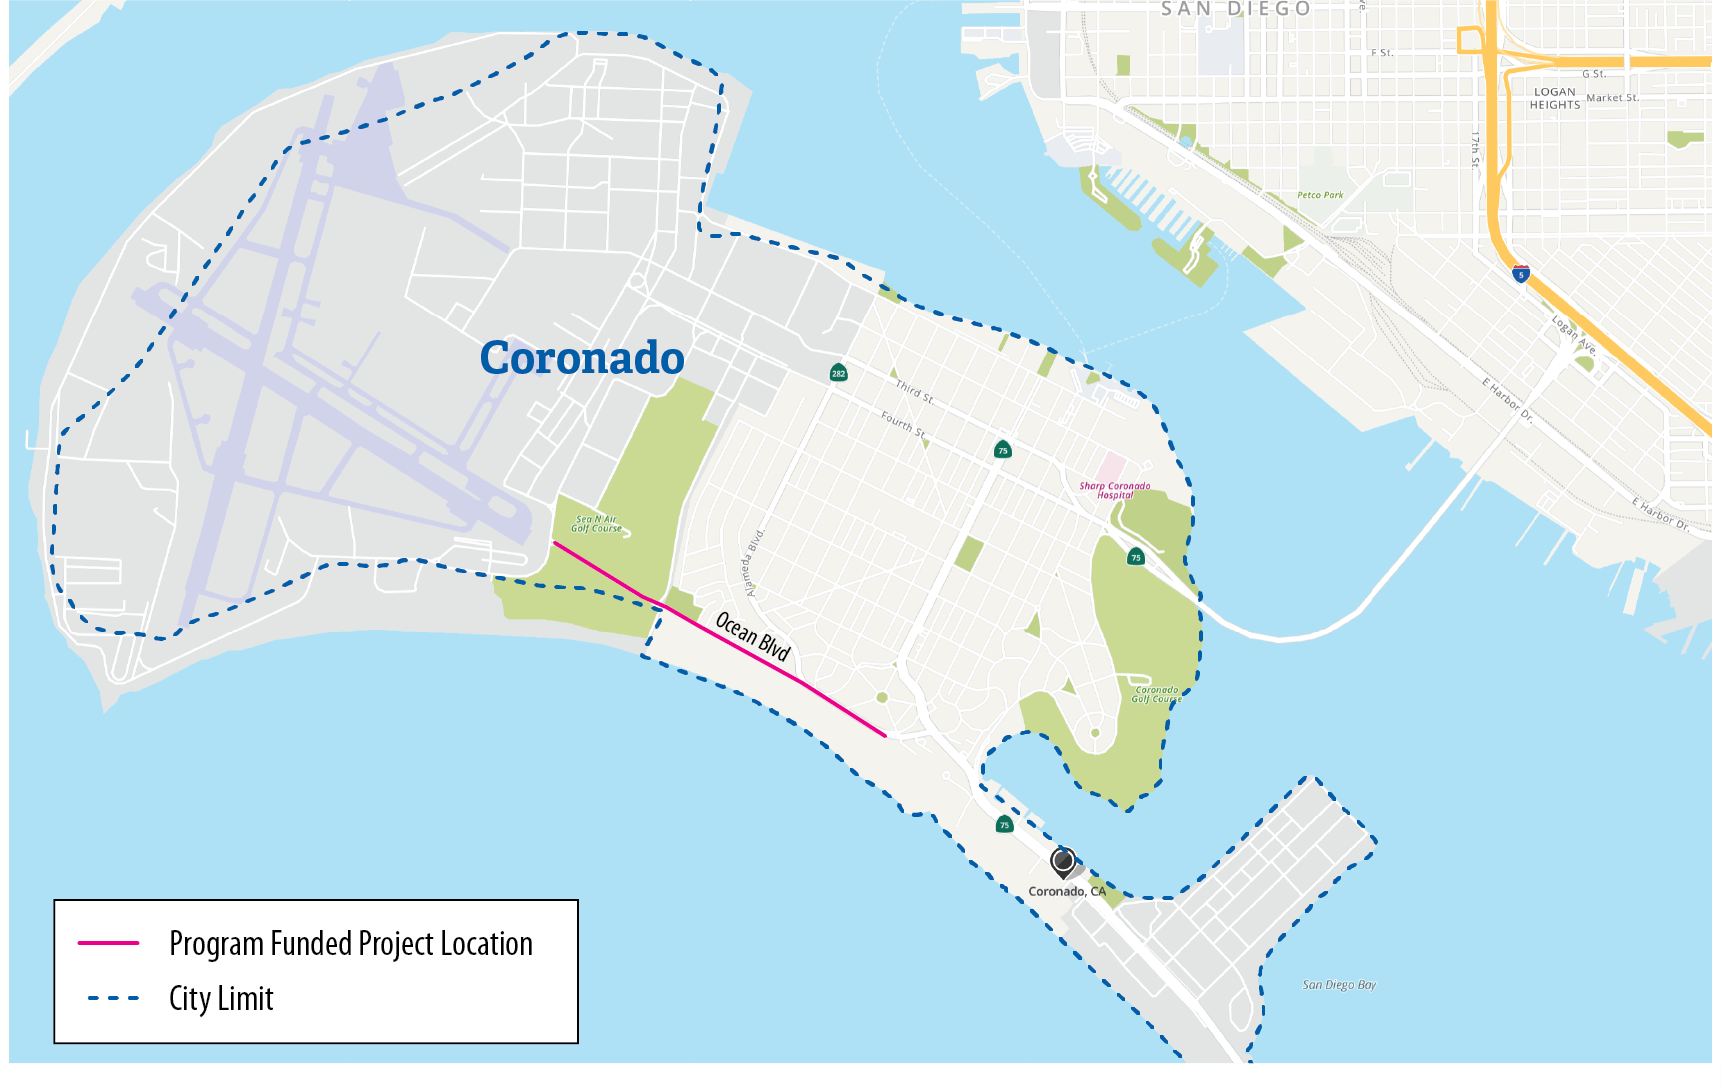
Source: The Office of Environmental Health Hazard Assessment and Coronado reporting to the Commission for fiscal years 2017–18 through 2021–22.
Figure A.3 is a map of Coronado with a blue dotted line outlining the city limit. There are no light green shaded areas within the City, which would indicate the location of designated disadvantaged communities. There is a red line indicating the Local Streets and Roads Program funded project location, which is Ocean Street that runs along the coast from an air force base towards the center of the city. Because the city does not have any disadvantaged communities, it also does not have any projects located in disadvantaged communities.
Figure A.4
In Fiscal Years 2017–18 and 2018–19, Oakland Spent Local Streets and Roads Program Funding on Projects Mostly Outside of Disadvantaged Communities
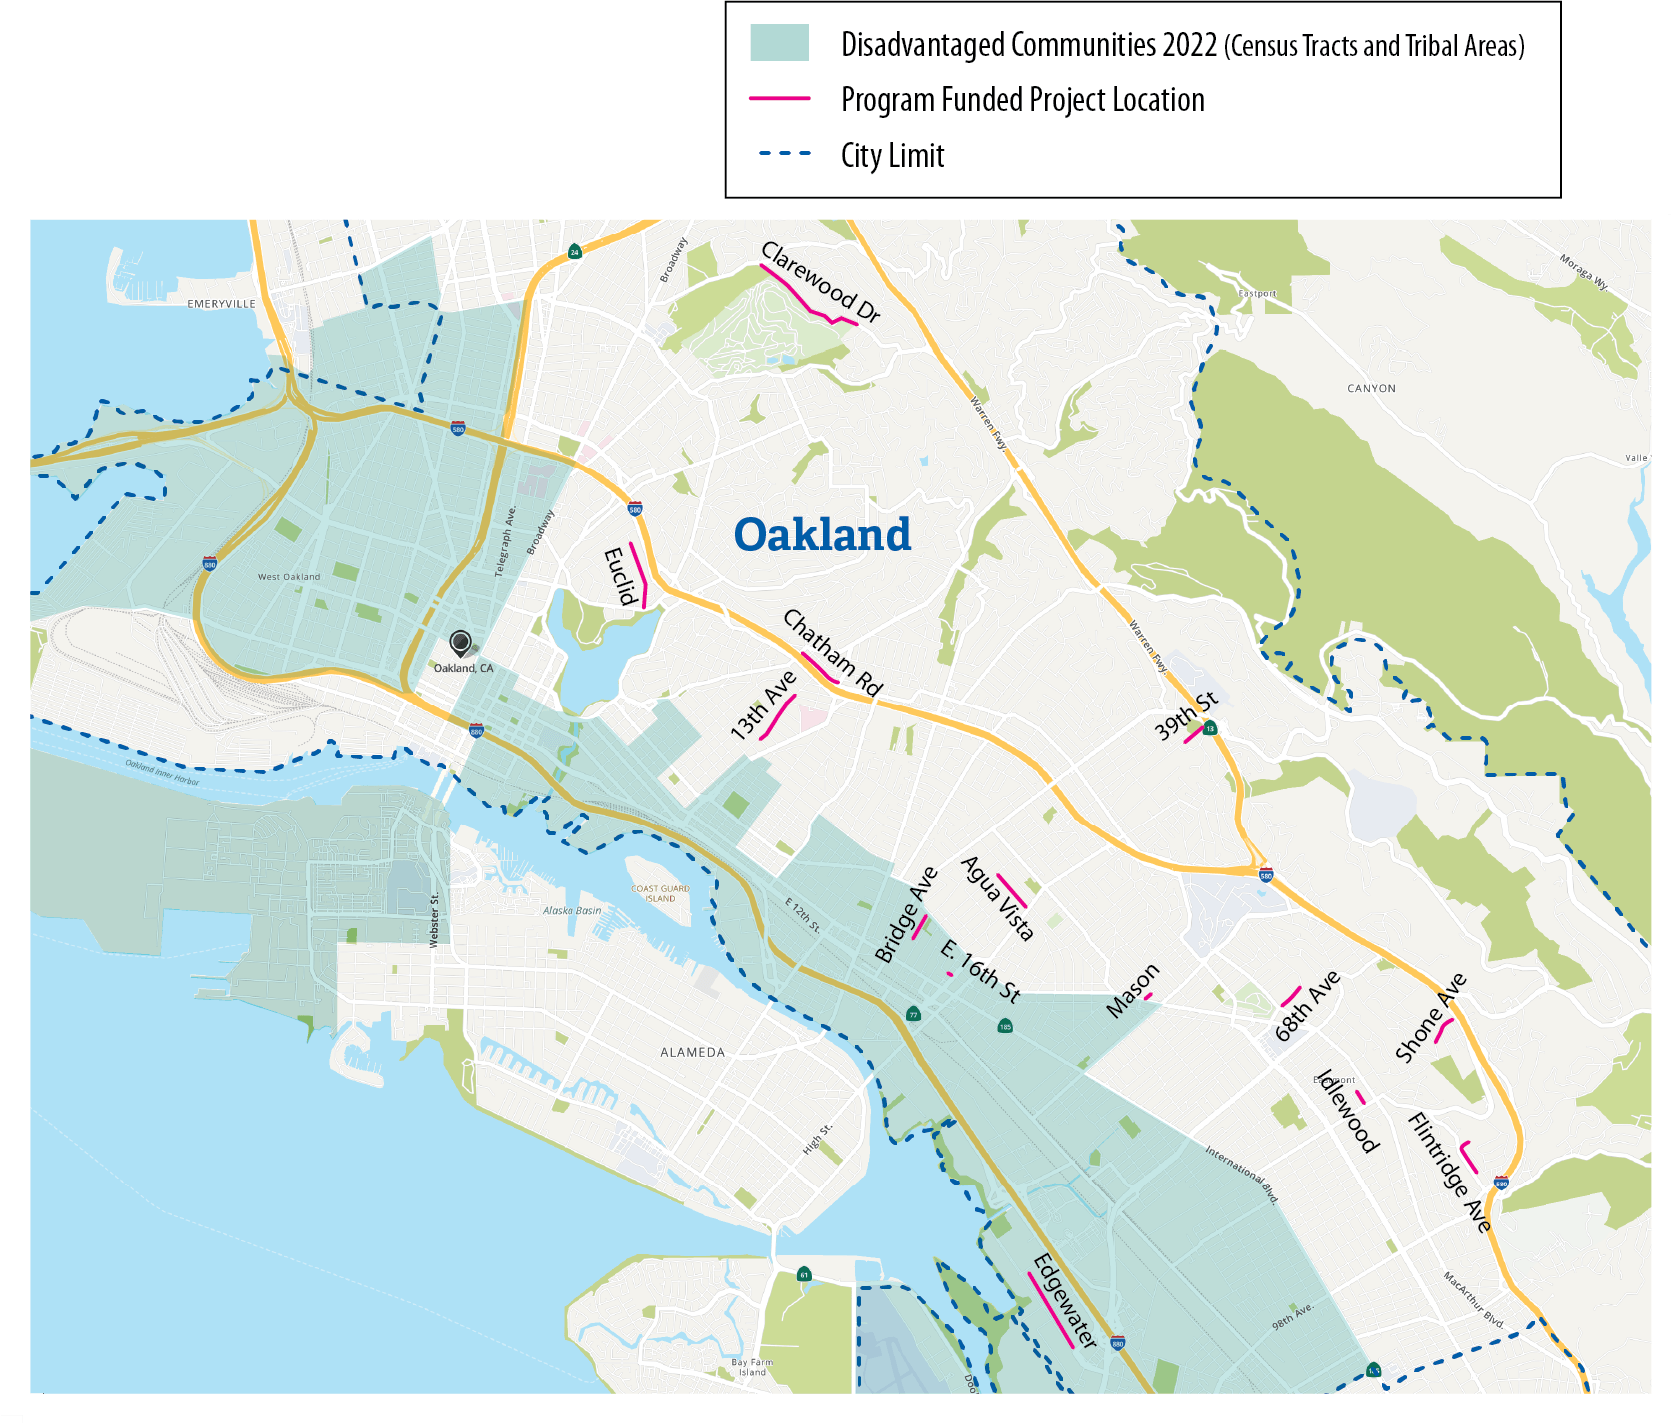
Source: The Office of Environmental Health Hazard Assessment and Oakland reporting to the Commission for fiscal years 2017–18 through 2021–22.
Note: Oakland’s public expenditure reports after fiscal year 2018–19 included the streets on which it performed maintenance and rehabilitation activity, but it did not indicate the beginning and ending locations for those projects. As a result, we were unable to map them here. To view a map of street maintenance and rehabilitation activity since that time, which addressed more streets in disadvantaged communities, see Oakland’s map at https://oakgis.maps.arcgis.com/apps/webappviewer/index.html?id=8aebdc3c3a5141648907385d28d2f45d
Figure A.4 is map of Oakland with a blue dotted line outlining the city limit. Light green shaded areas indicate designated disadvantaged communities within the city. There are red lines indicating program funded project locations. The majority of these lines are located outside of the green shaded area, in the northeastern 2/3rds of the city, which means that most of Oakland’s program funded projects during this time period were not located within the disadvantaged communities. This demonstrates why Oakland changed its approach to funding street maintenance and rehabilitation to focus more on disadvantaged communities.
Figure A.5
Riverside Has Spent Its Local Streets and Roads Program Funding on Street Maintenance Projects, Many of Which Are Located in Disadvantaged Communities
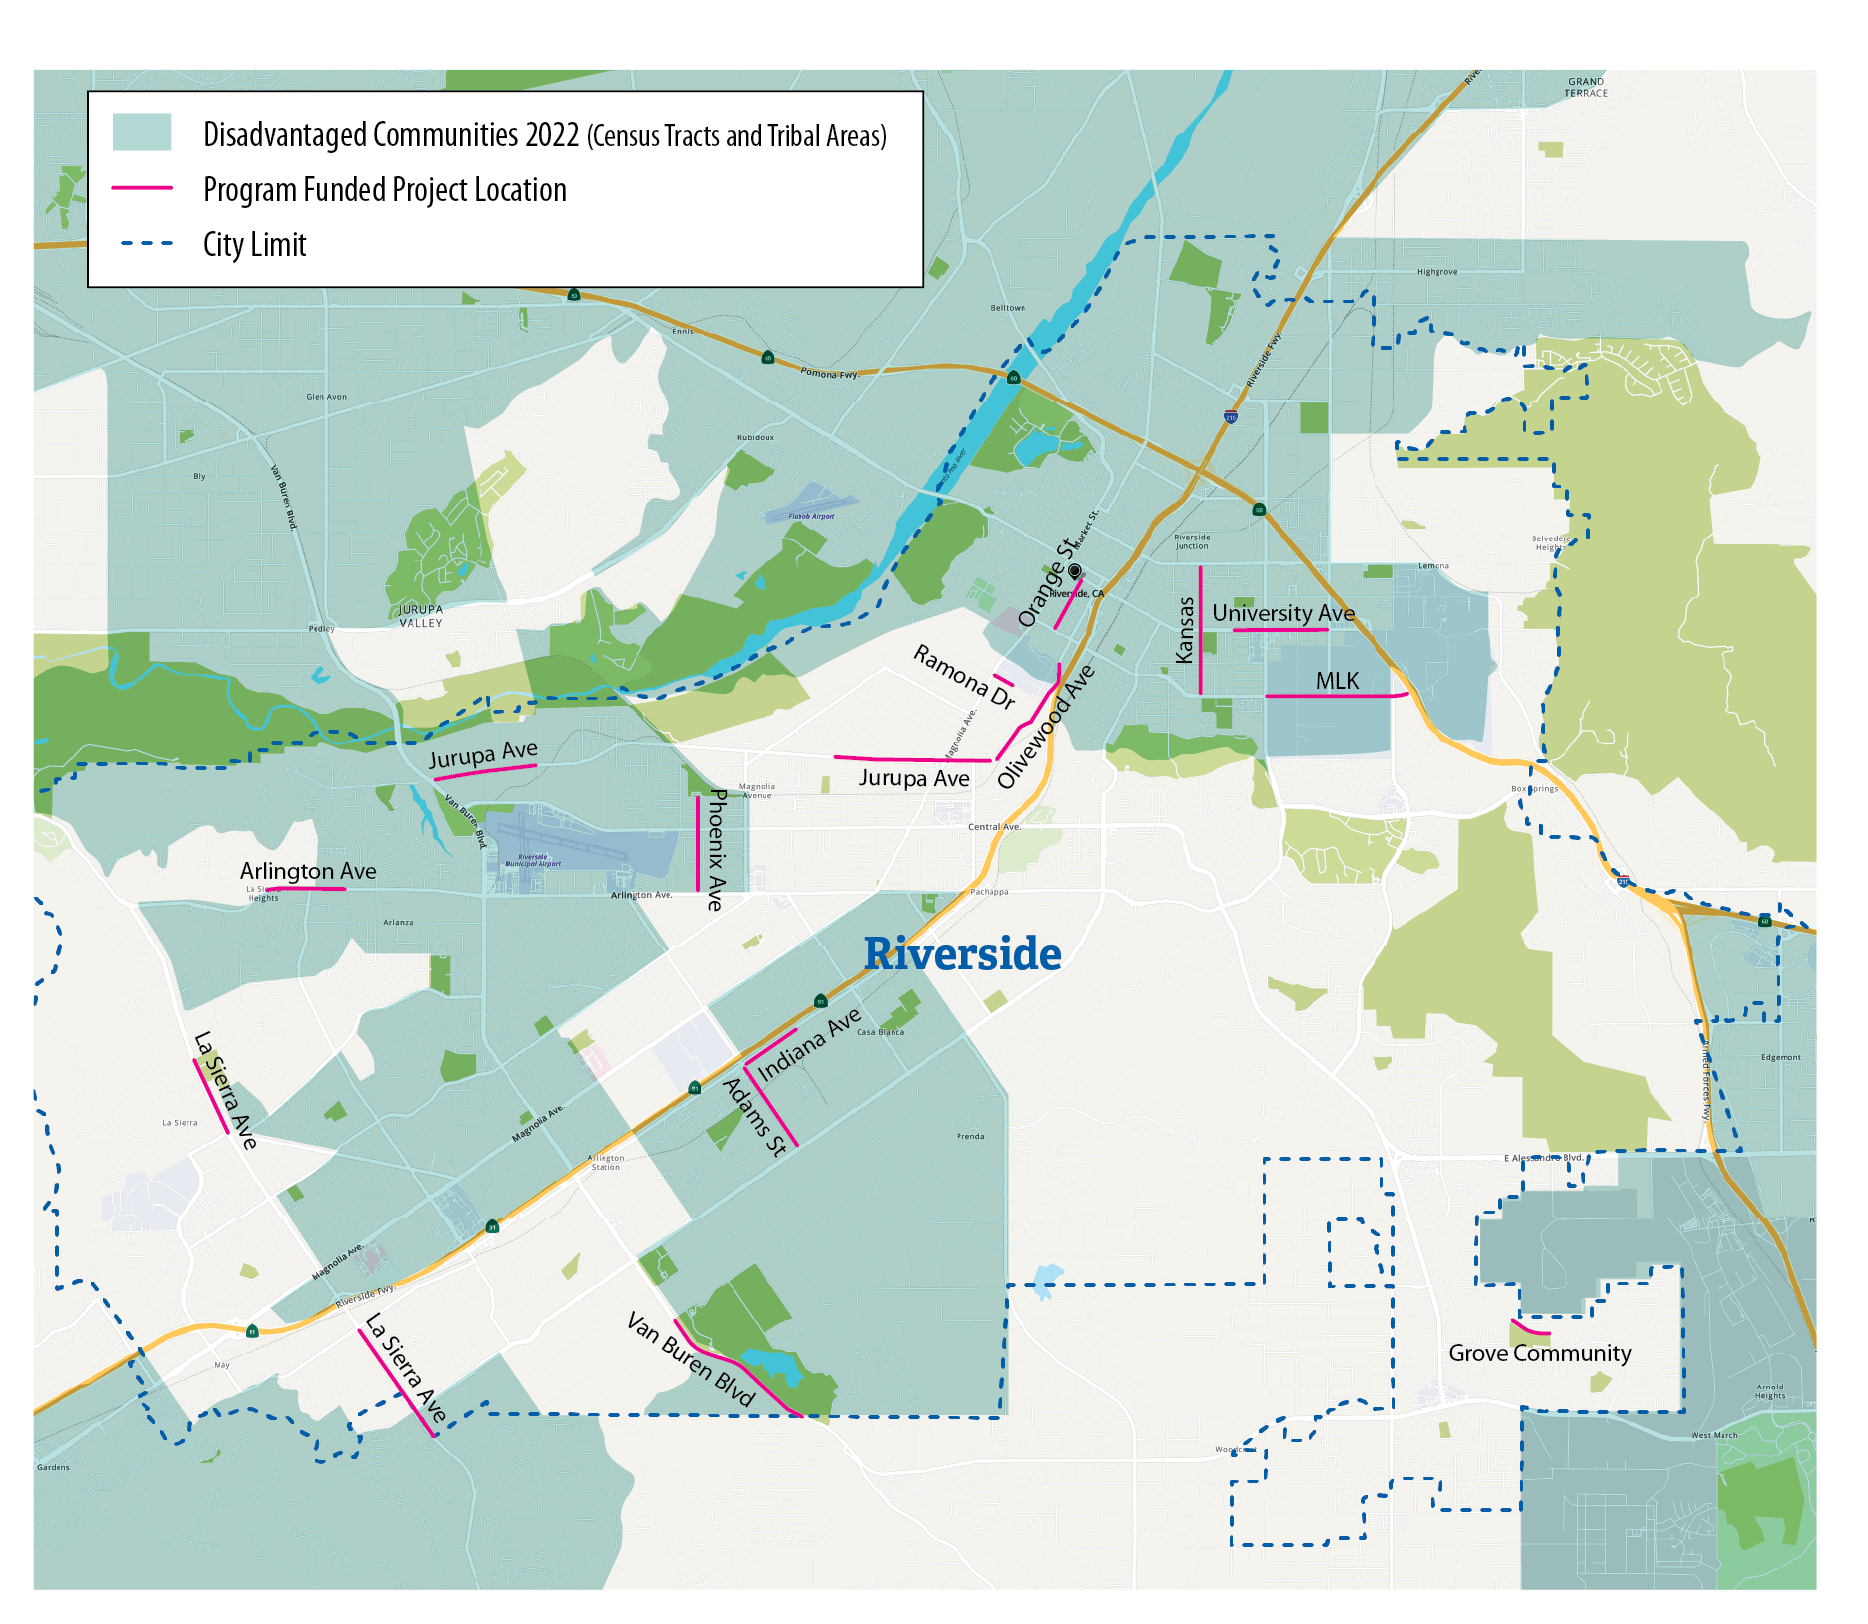
Source: The Office of Environmental Health Hazard Assessment and Riverside reporting to the Commission for fiscal years 2017–18 through 2021–22.
Note: This map includes only the largest projects that Riverside reported. The city also reported that it paved many smaller street segments and worked on traffic control devices, such as traffic signals.
Figure A.5 is a map of the Riverside with a blue dotted line outlining the city limit. Light green shaded areas throughout the City indicate designated disadvantaged communities within the City. There are red lines indicating program funded project locations. The majority of the projects shown are located with the shaded area, which means that many of Riverside’s program funded projects are located with disadvantaged communities. This map includes only the largest projects that Riverside reported. The city also reported that it paved many smaller street segments and worked on traffic control devices, such as traffic signals. Jurupa Ave, Phoenix Ave, Adams St. Indiana Ave, University Ave, Kansas, MLK, Orange St. are the projects located within disadvantaged communities. Although most projects are in the center of the city, many are located in the western part of the city as well.
Figure A.6
Yuba City’s Local Streets and Roads Program Projects Were Located in or Adjacent to Disadvantaged Communities
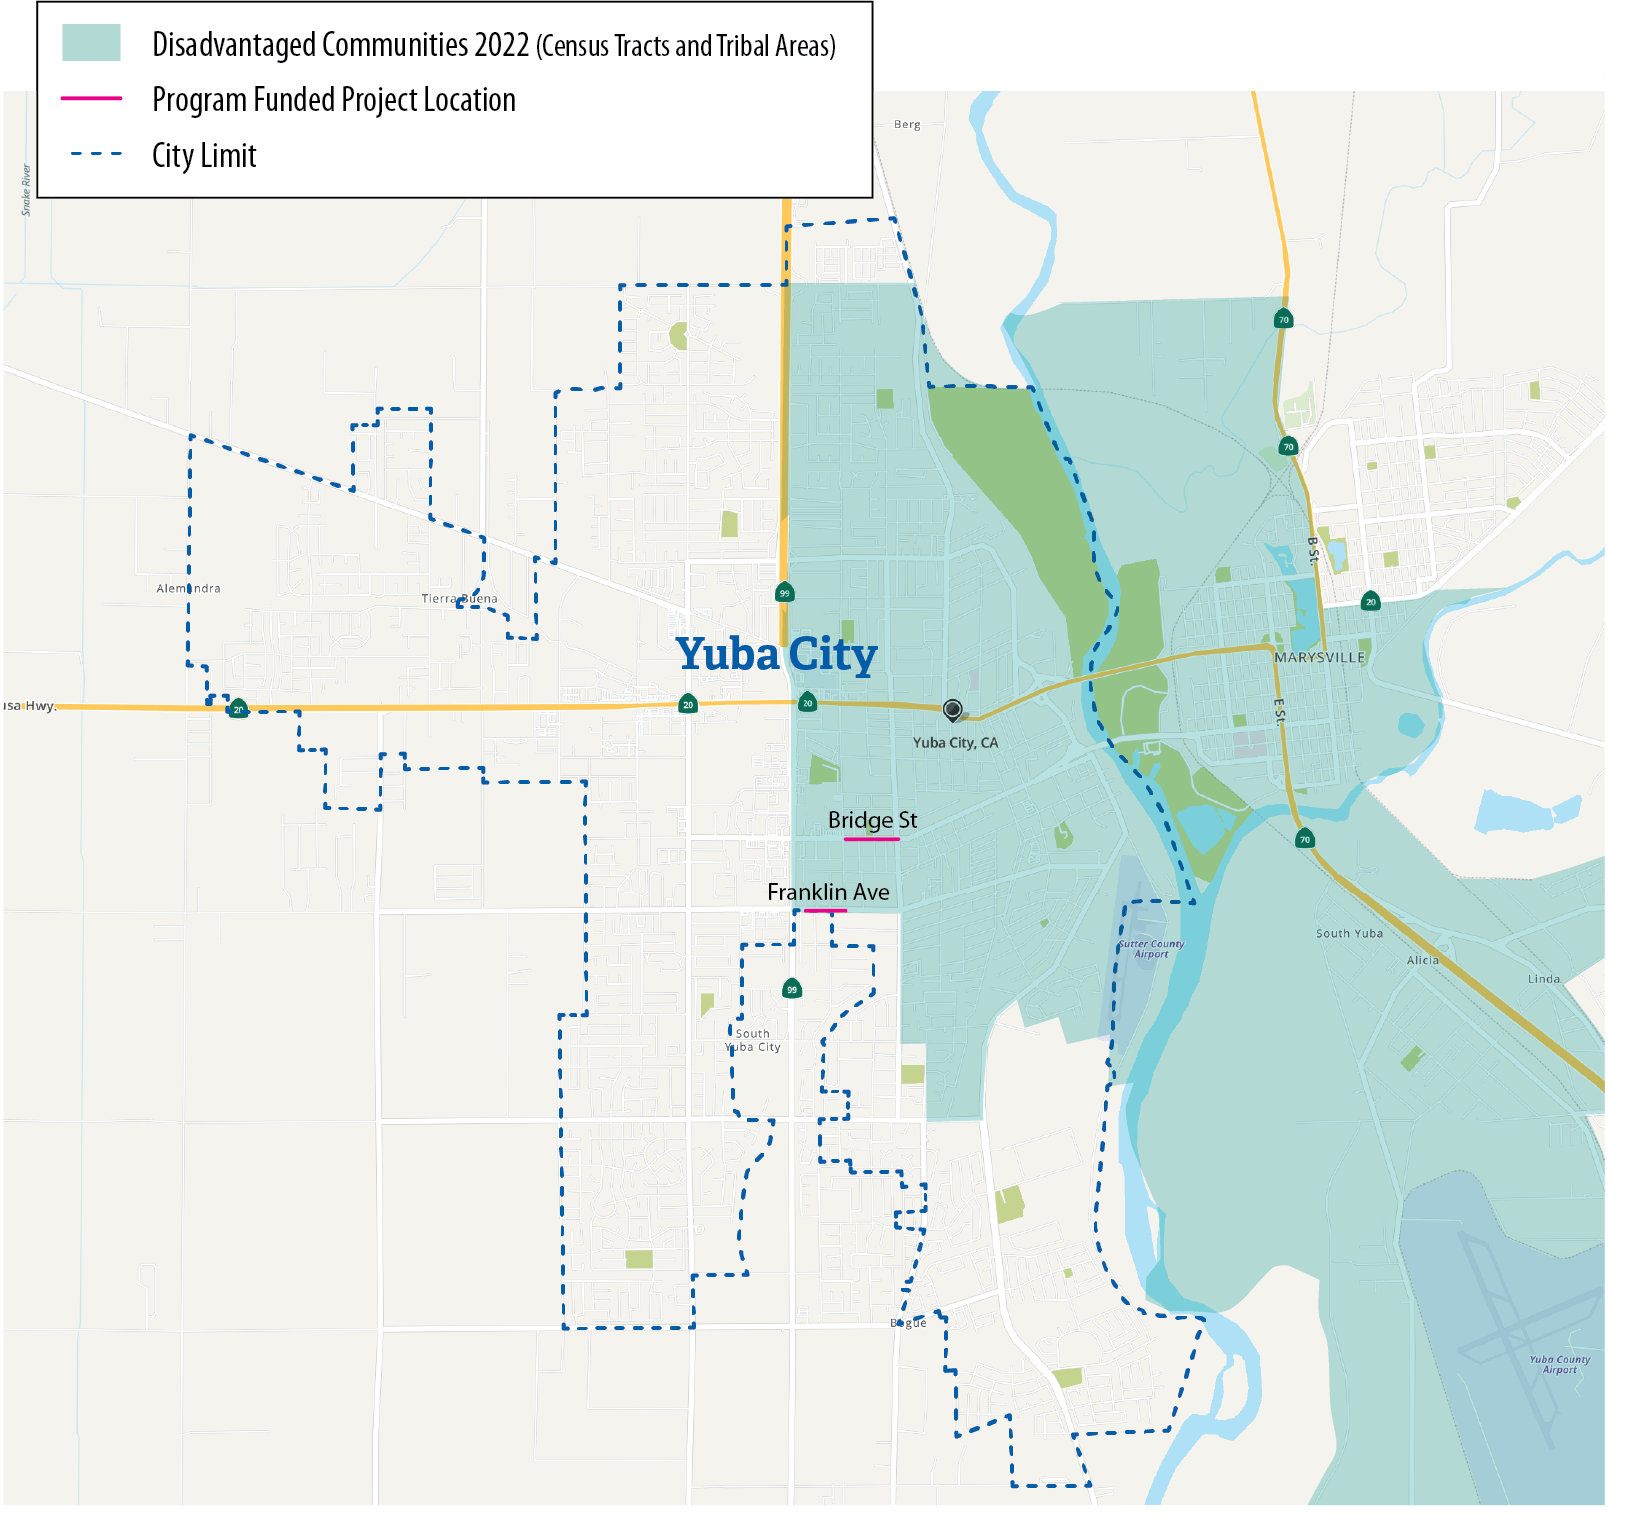
Source: The Office of Environmental Health Hazard Assessment and Yuba City reporting to the Commission for fiscal years 2017–18 through 2021–22.
Figure A.6 shows a map of Yuba City with a blue dotted line outlining the city limit. A green shaded area on the eastern side of the City indicates designated disadvantaged communities. There are two red lines on the map which indicate program funded project locations. One line, labeled Bridge St., is located within the blue shaded area. The second project, Franklin Ave., is located on the border of that blue shaded area. This map shows that of the two projects are located in or adjacent to a disadvantaged community, near the center of the city.
Appendix B
Scope and Methodology
The Audit Committee directed the California State Auditor to conduct an audit of state and local oversight of the Local Streets and Roads Program to provide independently developed and verified information. Specifically, we reviewed and verified information to confirm that state agencies are facilitating the program appropriately, and we evaluated how cities use funds to improve the conditions of local streets. Table B lists the objectives that the Audit Committee approved and the methods we used to address them. Unless otherwise stated in the table or elsewhere in the report, statements and conclusions about cities selected for review should not be projected to all cities.
Assessment of Data Reliability
The U.S. Government Accountability Office, whose standards we are statutorily obligated to follow, requires us to assess the sufficiency and appropriateness of computer‑processed information we use to support our findings, conclusions, or recommendations. In performing this audit, we relied on electronic data files that we obtained from the State Controller, the Commission’s website, and accounting reports from the six cities that we visited. To verify the accuracy of the State Controller and Commission data, we reviewed accounting reports and ensured that they agreed with State Controller payment information and Commission spending data. We did not perform completeness testing on these data files because they are mainly sourced to other electronic files and are paperless. Although we recognize that these limitations may affect the precision of the numbers we present, there is sufficient and appropriate evidence to support our findings, conclusions, and recommendations.
Response
California State Controller
March 15, 2024
Mr. Grant Parks
California State Auditor
621 Capitol Mall, Suite 1200
Sacramento, CA 95814
SUBJECT: Local Streets and Roads Program Audit, Report Number 2023-124
Dear Mr. Parks:
The California State Controller’s Office appreciates the opportunity to provide comments and address the recommendations included in the California State Auditor’s Local Streets and Roads Program audit. As the California State Controller, I am deeply committed to ensuring the accurate and timely disbursement of the Local Streets and Roads Program funds and ensuring accountability of local governments in expending these funds to maintain and fix deteriorating streets and roads throughout California.
We appreciate the California State Auditor’s Office confirming that the State Controller’s Office is properly administering program eligibility, payment, and the reporting process. Additionally, we appreciate California State Auditor’s recognition that the State Controller’s Office continues to monitor the 481 cities and 58 counties for compliance with the maintenance of efforts requirements with limited staff resources. We value the acknowledgement of our audit efforts prior to the reduction of the staff resources by 57 percent due to the four limited-term positions expiring in 2020. The State Controller’s Office is committed to the implementation of the recommendations below and the enforcement of the city and county maintenance of effort requirements as prescribed by law.
Please see our responses to the recommendations below.
Recommendation 1
To ensure that cities and counties are held accountable to state law and are not supplanting local spending with program funds, by October 2024, the State Controller should begin auditing cities and counties that it identifies as at risk of not meeting the maintenance-of-effort requirement. It should withhold program funds in the amount prescribed by law from cities and counties that it concludes have not complied with the requirement.
State Controller’s Office Response to Recommendation 1
Concur. The State Controller’s Office will continue to pursue resources to perform the maintenance of effort audits and is optimistic that the California State Auditor’s report will assist the State Controller’s Office in supporting our continued requests. Without audits to verify whether cities and counties have complied with the maintenance of effort requirements, the State Controller’s Office cannot withhold program funds and enforce the maintenance-of-effort requirement.
The State Controller’s Office’s authorized positions were reduced from 7 to 3 (57 percent) when the four limited-term positions designated to conduct audits expired in 2020. As indicated in the audit report, the State Controller’s Office began conducting 65 audits of cities and counties for Fiscal Years 2017-18 and 2018-19. However, the State Controller’s Office did not have resources to initiate additional audits after the four limited-term positions expired.
The remaining three permanent positions continue to monitor the maintenance of effort compliance of the 481 cities and 58 counties by receiving city and county’s streets and roads reports, tracking expenditures, providing outreach, and performing desk reviews. In anticipation of obtaining additional resources to conduct audits, the State Controller’s Office developed an audit plan based on information obtained during our desk reviews and initiated a few audits. However, these audits are currently on hold and may need to be canceled due to a lack of resources.
① Recommendation 2 To ensure that cities and counties are held accountable to state law and are not continuing to supplant local spending with program funds, the State Controller should by October 2024 revise its practice to only allow cities or counties to violate the requirement for two fiscal years, rather than continually, as under its current practice. After two years’ noncompliance, the State Controller should withhold program funds in accordance with state law.
State Controller’s Office Response to Recommendation 2
Concur. The State Controller’s Office has fully implemented the California State Auditor’s recommendation to only allow cities or counties two fiscal years to meet their maintenance of effort requirements instead of the previous method applied.
Recommendation 2: “For both recommendations, the State Controller’s Office concurs that program funds should be withheld after an audit for cities and counties that do not meet the maintenance of effort requirements in accordance with state law. However, the State Controller’s Office has concerns regarding the maintenance of effort enforcement methodology illustrated in Figure 2 for Fiscal Year 3, which indicates that only the maintenance of effort shortfall would be withheld in Year 3.
The Streets and Highways Code, Section 2036 (a) indicates that cities and counties shall maintain their existing commitment of local funds for street, road, and highway purposes in order to remain eligible for an allocation or apportionment of funds pursuant to Section 2032. Additionally, the Streets and Highway Code Section 2036 (e) states that the Controller shall withhold from its apportionment pursuant to Section 2032 for a fiscal year following an audit an amount up to the amount of funds that the city or county received during the fiscal year that was audited. Therefore, the State Controller’s Office believes that state law would require the entire Local Streets and Roads Program allocation or apportionment for the applicable year audited to be withheld after an audit confirms noncompliance with the maintenance of effort requirement versus only the shortfall amount.
Thank you for the opportunity to provide our response to the audit report. The State Controller’s Office appreciates the professionalism and the dedication of the California State Auditor’s Office staff.
If you have any questions regarding the SCO’s comments, please contact Kim Tarvin, Division Chief, Division of Audits at 916-324-1696 or ktarvin@sco.ca.gov.
Sincerely,
Malia Cohen
California State Controller
CALIFORNIA STATE AUDITOR’S COMMENT ON THE RESPONSE FROM THE CALIFORNIA STATE CONTROLLER
To provide clarity and perspective, we are commenting on the response to our audit report from the State Controller. The number below corresponds with the number we have placed in the margin of the State Controller’s response.
① As part of our quality control process, our standard practice is to provide agencies five working days to review and comment on a draft copy of the report. During this time, we encourage agencies to discuss with us any concerns they may have regarding the report. In keeping with this practice, we updated our text here to better reflect the ambiguity in state law related to the amount of program funds that the State Controller would be required to withhold from cities and counties that do not meet the maintenance-of-effort requirement. Further, we include a recommendation to the Legislature that it address this issue by amending state law to provide clarity.
- A construction project to physically separate a road from a railroad track, such as by building a bridge, is called a grade separation project. Complete Street components include sidewalk widening and adding bicycle lanes to streets. Traffic control devices include stop signs and traffic signals. ↩︎
- We did not audit or review the Active Transportation Program because it is outside of the scope of the Local Streets and Roads Program. ↩︎
- For fiscal year 2019–20, the Legislature suspended the maintenance‑of‑effort requirement. ↩︎
- The city of Rolling Hills has no public streets. It has only private streets and is therefore not eligible to receive program funds. ↩︎
