
2023-126 California Community Colleges
Oversight of the 50 Percent Law Is Ineffective, and the Law Could Be Amended to Better Support Students
Published: April 8, 2025Report Number: 2023-126
April 8, 2025
2023‑126
The Governor of California
President pro Tempore of the Senate
Speaker of the Assembly
State Capitol
Sacramento, California 95814
Dear Governor and Legislative Leaders:
As directed by the Joint Legislative Audit Committee, my office conducted an audit of the California Community Colleges (CCC), which included a review of 10 of the 73 CCC districts (districts). Our evaluation focused on districts’ compliance with the 50 Percent Law and district investment in administrators compared to faculty and support staff. All districts are subject to a state law that generally requires them to spend at least 50 percent of their current expense of education on the salaries of classroom instructors—meaning that a compliance rate of 50 percent or greater meets the law’s requirements. The following report details the audit’s findings and conclusions.
My office determined that the 50 Percent Law limits districts’ ability to fund services outside of the classroom that may better support student success. The modern higher education landscape is vastly different than when the 50 Percent Law was passed in 1961, and the law in its current form does not account for these changes, such as the larger role of support from counselors and librarians, and technological changes. Additionally, although most of the 73 districts report that they have complied with the 50 Percent Law, the Chancellor’s Office’s limited oversight allowed multiple districts to inaccurately report their compliance rates. This was, in part, due to the Chancellor’s Office not providing regular trainings to districts on reporting requirements and not conducting its own review of districts’ reporting. Lastly, available data indicate that districts’ investment in administrators has increased at a greater rate than that for faculty. The most common factor cited by districts for this increase was the need to hire managers to administer expanding grant programs. To address our findings, the Legislature could amend the 50 Percent Law to better support student success and the Chancellor’s Office should provide districts with regular trainings for reporting on the 50 Percent Law.
Respectfully submitted,
GRANT PARKS
California State Auditor
Selected Abbreviations Used in This Report
| ACBO | Association for Chief Business Officials |
| CCC | California Community Colleges |
| CDE | California Department of Education |
| CPA | Certified Public Accountant |
| FON | Faculty Obligation Number |
| FTE | Full-time equivalent |
| FTES | Full-time equivalent students |
| ISA | Instructional Service Agreements |
| MIS | Management Information System |
| SCFF | Student Centered Funding Formula |
Summary
Key Findings and Recommendations
The California Community Colleges (CCC) are overseen by the Office of the Chancellor of the CCC (Chancellor’s Office) and serve nearly two million students at 73 districts across the State. All CCC districts (districts) in California are subject to a state law that generally requires them to spend at least 50 percent of their current expense of education (Current Educational Expense) on the salaries of classroom instructors (Instructor Salaries)—meaning that a compliance rate of 50 percent or greater meets the law’s requirements. This law is commonly referred to as the 50 Percent Law. Enacted in 1961, the law was based on a Senate fact‑finding committee’s proposal to reduce class size and improve student success.
The Joint Legislative Audit Committee (Audit Committee) asked us to review a selection of 10 districts’ compliance with the 50 Percent Law, the Chancellor’s Office’s oversight of districts’ compliance, and overall district investment in administrators compared to faculty and support staff. Our review concluded that because of the evolution of classroom instruction since the law’s enactment, districts must weigh complying with the law against increasing their spending on noninstructional services that may also support students, such as spending on librarians, counselors, and new technology. Further, we found that most of the 73 districts reported having complied with the 50 Percent Law, but that the Chancellor’s Office’s oversight of compliance is insufficient, allowing for districts’ incorrect reporting to remain undetected.
The 50 Percent Law Limits Districts’ Ability to Fund Services Outside of the Classroom That Support Student Success
Modern higher education is vastly different than it was in the 1960s, and student instruction and learning now often requires advanced technologies, virtual instruction, and support for students outside of the traditional learning space. Because only the salaries and certain benefits of classroom instructors and instructional aides are included as Instructor Salaries in the 50 Percent Law’s compliance calculation, the 50 Percent Law forces districts to weigh spending enough on the salaries of classroom instructors to comply with the law against providing other services that do not contribute to compliance but still support student success. If the Legislature were to amend the 50 Percent Law to include the salaries of support services personnel, such as those of librarians and counselors, into the Instructor Salaries portion of the formula, it could increase districts’ compliance rates while also helping students succeed.
We reviewed 10 districts’ spending on basic needs services, such as programs that help students with food and housing.1 Although the districts we reviewed tracked information on basic needs services spending inconsistently, most districts reported that basic needs services spending does not significantly affect their compliance with the 50 Percent Law. Because the Chancellor’s Office does not fully prescribe how districts should account for all basic needs services, districts did not consistently track expenses for them. Most of the districts that were able to provide self‑reported information regarding their funding for basic needs services indicated that basic needs services are primarily funded using funds whose use is restricted to a specific purpose (restricted funds), such as federal or state grants. Restricted funds are excluded from the 50 percent formula and therefore do not affect districts’ compliance rates. However, some districts we reviewed explained that if restricted funds become less available, districts might need to cut services, find other restricted funding, or use unrestricted funding to pay for basic needs services. Using unrestricted funds to pay for basic needs services could affect their compliance with the 50 Percent Law.
The Chancellor’s Office’s Limited Oversight Allowed Multiple Districts to Inaccurately Report Their Compliance Rates
Districts are required to report compliance with the 50 Percent Law to the Chancellor’s Office in their annual financial and budget reports (financial reports), and from fiscal years 2018–19 through 2022–23, only five of the 73 districts self‑reported noncompliance with the 50 Percent Law. The Chancellor’s Office relies on annual Certified Public Accountant (CPA) audits to gain confidence in the accuracy of these financial reports, including the 50 percent calculation, but we found errors in reporting from many of the districts we reviewed that the CPA audits did not identify. We reviewed 30 transactions that took place during five fiscal years at each of the 10 districts we selected for review, for a total of 300 transactions. The errors we identified included districts incorrectly reporting certain transactions as Instructor Salaries and incorrectly categorizing noninstructional personnel. The districts’ reporting errors we identified resulted in them overstating their compliance rates. However, not all cases resulted in a large enough change to affect their compliance with the 50 Percent Law.
We attribute the errors, in part, to a lack of guidance and oversight from the Chancellor’s Office. The training that the Chancellor’s Office provides to districts is insufficient and its guidance is sometimes incorrect or unclear. Additionally, the Chancellor’s Office lacks an effective method to hold certain noncompliant districts accountable. Its current method is to withhold state apportionment money from noncompliant districts; however, the districts that repeatedly report noncompliance are districts that do not receive state apportionment funds and are supported by community funding. Because there is no state apportionment funding to withhold from these districts, the Chancellor’s Office lacks a mechanism to hold these districts accountable for complying with the 50 Percent Law.
Available Data Indicate That Districts’ Investment in Administrators Has Increased at a Greater Rate Than Their Investment in Faculty
Data show that districts’ investment in administrators, including management and executives, far outpaced their investment in faculty, which includes classroom instructors. Statewide data show that from fiscal years 2013–14 through 2023–24, districts increased the number of administrators by 45 percent compared to an increase of just 3 percent for faculty and 7 percent for support staff. However, we identified anomalies and discrepancies in the Chancellor’s Office statewide staffing and salary data that made us question its reliability. Nevertheless, because it is the most readily available source of the aggregate data across 73 districts, we present the Chancellor’s Office’s data in this report.
The districts we reviewed pointed to several factors that contributed to this increased spending on administrators. The most common factor they cited was the need to hire managers to administer expanding grant programs, such as personnel to manage grants. Although districts have discretion to create new administrator positions, districts’ justifications for creating those positions were inconsistent. For example, our review of documentation districts use when creating and justifying new positions found that many districts referenced workload, but some districts did not always make a direct connection to workload needs. Regardless of staffing changes, student success outcomes appear to have increased statewide during the last five fiscal years.
To address these findings, we recommend that the Legislature consider including the salaries and benefits of librarians and counselors in Instructor Salaries, or the numerator of the 50 percent formula, and excluding technology expenses related to instruction from the 50 percent formula. To offset the impact of including additional costs in the numerator, the Legislature may also consider raising the compliance requirement to above 50 percent. We also propose that the Chancellor’s Office provide the districts with regular training and clarify its existing guidance for districts’ reporting on the 50 Percent Law.
Agency Comments
The Chancellor’s Office agreed with our recommendations and indicated that it will take actions to implement them. Because we did not make recommendations to the 10 districts we reviewed, we did not expect a response from them; however, one district—San Mateo County Community College District—provided a response in which it disagreed with some of our findings and conclusions.
Introduction
Background
The CCC—which serves nearly two million students and comprises 116 colleges within 73 districts in the State—plays a unique role in California’s public higher education structure. Unlike the California State University and University of California institutions, community colleges must admit any California residents possessing a high school diploma or equivalent. Community colleges must provide academic and vocational instruction at the lower division level that may culminate in an associate degree or transfer to a four‑year institution.
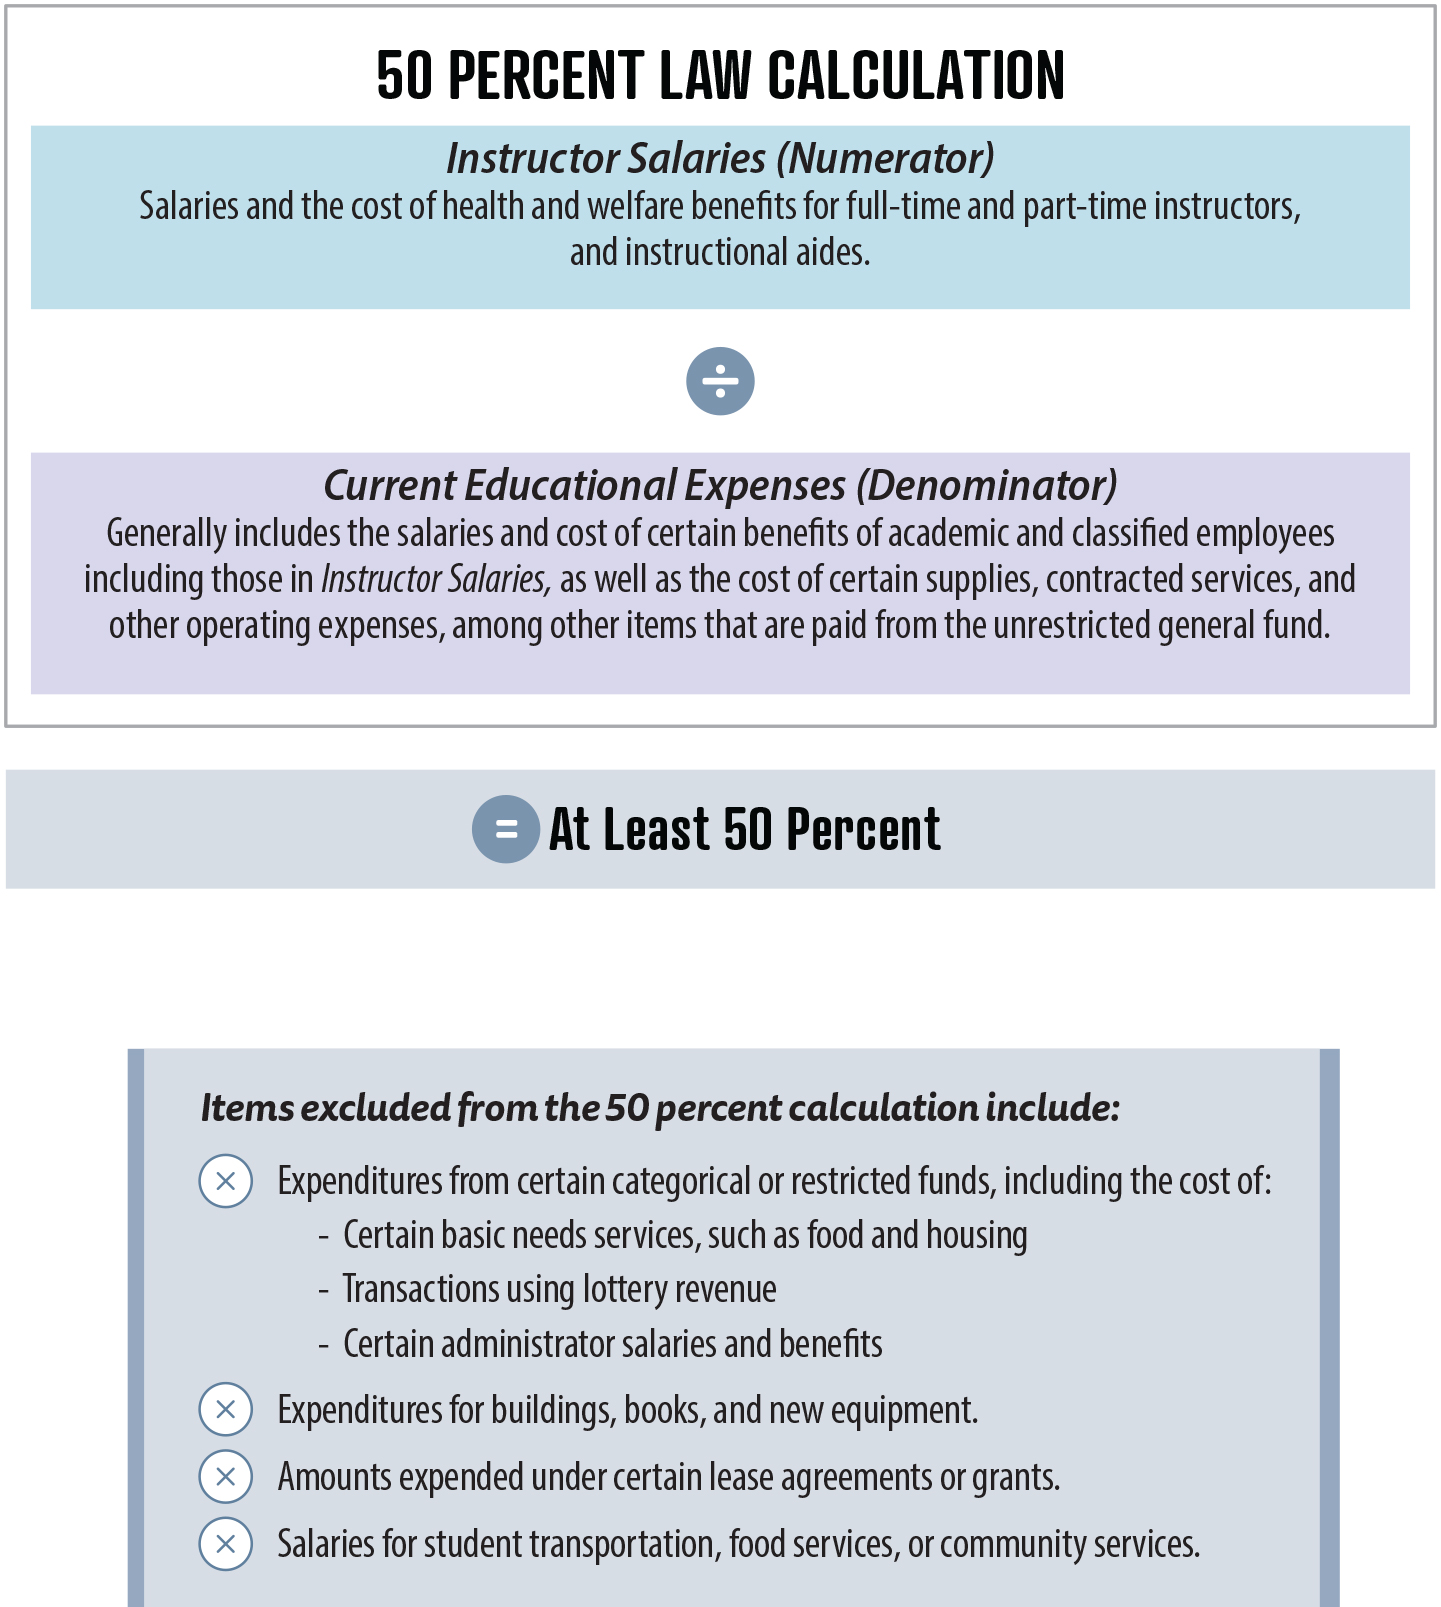
All districts in California are subject to the 50 Percent Law, which requires them to spend at least 50 percent of their current expense of education (Current Educational Expenses, or the denominator) on the salaries of classroom instructors (Instructor Salaries, or the numerator). State law describes the criteria for what districts must include in Instructor Salaries and Current Educational Expenses, as Figure 1 shows. Districts must prorate in Instructor Salaries the salaries of instructors who perform some noninstructional activities as part of their work so that only the portion of their salaries spent on instructional duties are included in the numerator of the 50 percent formula. Instructor Salaries does not include salaries of noninstructional staff, such as executives, administrators, counselors, librarians, and health professionals. The 50 Percent Law excludes portions of districts’ budgets from Current Educational Expenses, including certain state or federal grants, restricted funds, and certain types of categorical funds. Restricted and categorical funds are generally those funds whose uses are restricted to specific purposes, and would include lottery revenue.
Figure 1
The 50 Percent Law Requires Districts to Spend a Minimum Percentage of Funds on Instructor Salaries and Benefits
Source: Chancellor’s Office documents, districts’ documents, and state law.
This is an infographic that depicts a visual representation of the 50 Percent Law calculation, which requires that Instructor Salaries, or the numerator, be divided by Current Educational Expenses, or the denominator, to equal at least 50 percent. Instructor Salaries are the salaries and the cost of certain health and welfare benefits for full-time and part-time instructors, and instructional aides. Current Educational Expenses generally includes the salaries and cost of certain benefits of academic and classified employees including those in Instructor Salaries as well as the cost of certain supplies, contracted services, and other operating expenses, among other items, that are paid from the unrestricted general fund. Below the equation is a list of items that are excluded from the 50 percent calculation, which include expenditures from certain categorical or restricted funds, including the cost of certain basic needs services such as food and housing, transactions using lottery revenue, and certain administrator salaries and benefits. The list also includes expenditures for buildings, books, and new equipment; amount expended under certain lease agreements or grants; and salaries for student transportation, food services, or community services.
The bill enacting the 50 Percent Law was based on the findings and conclusions of a Senate fact‑finding committee report noting that large class sizes result in teachers giving less individual attention to students, adversely affecting students’ ability to compete with students from states with smaller class sizes. In the report, the committee proposed changes to the law to require a specific level of spending on instructor salaries in an effort to reduce classroom sizes and improve student success. In a letter urging the Governor to approve the bill enacting the 50 Percent Law, one of the bill’s authors also stated that the law in effect at the time made it possible to use state funds to hire instructors to perform administrative work rather than classroom teaching, allowing costs for administrative staffing in education to increase, and that the bill would implement sound guidelines for spending state funds for teachers’ salaries.
An 18‑member board of governors (CCC Board of Governors) governs the CCC. The CCC Board of Governors provides leadership and direction to the districts by carrying out certain responsibilities required by state law. The CCC Board of Governors appoints the Chancellor, who acts as the system‑wide chief executive officer. The CCC Board of Governors has granted the Chancellor’s Office specific oversight of aspects of districts’ fiscal management, staff monitoring, and budget‑reporting practices.
In its role as the oversight entity responsible for ensuring that districts report compliance with the 50 Percent Law, the Chancellor’s Office publishes district reporting of compliance with the law, provides guidance to districts on the law, and is responsible for holding noncompliant districts accountable. The Chancellor’s Office also distributes the Budget and Accounting Manual (accounting manual), the majority of which has the authority of regulation and which each district must follow. The accounting manual provides accounting procedures for consistent and comparable reporting of financial data by all districts. The Chancellor’s Office also operates and manages the Management Information System (MIS), as a requirement of state law. Districts are required to submit data to MIS, such as staffing numbers, annual compensation, and student success metrics.
Evolution of the CCC Since the Passage of the 50 Percent Law
Figure 2 illustrates just a few of many aspects that have changed since the State passed the 50 Percent Law in 1961. The CCC Board of Governors was itself not established until six years later in 1967. Public school employee collective bargaining rights, whereby teachers could collectively negotiate their salaries, were not established until the Educational Employment Relations Act was passed in 1975. Further, voters approved Proposition 13 in 1978, which had the effect of reducing funding for community colleges, and approved Proposition 98 in 1988, which established a minimum level of state funding for schools and community college districts.
Figure 2
Both Technology and Laws Related to the CCC Have Changed Since the Enactment of the 50 Percent Law

Source: Chancellor’s Office reports, state law, and public websites.
The 50 Percent Law was enacted in 1961. The formation of the CCC Board of Governors occurred in 1967. The Educational Employment Relations Act passed in 1975, which established public school employee collective bargaining rights. Microsoft Windows was first released in 1985, and its products list Microsoft Word were later used by many students. The Legislature passed Assembly Bill 1725 in 1988, which recognized a goal that full-time instructors teach at least 75 percent of all hours of credit instruction. In 1993, the World Wide Web was released to the public. Google was founded in 1998, a predominate search platform used by students. In 2011, Zoom was founded and later used for online distance learning. The implementation of the Student Centered Funding Formula occurred in 2018, which allocates a portion of district funding based on student success metrics. In 2020, the pandemic leads to a shift to distance (online) education.
Since the passage of the 50 Percent Law more than 60 years ago, technological progress has also transformed the CCC. Districts today spend funds on software, computers, and other IT equipment and services that did not exist in 1961. Further, many students choose to enroll in online distance education courses, a trend accelerated by the onset of the COVID‑19 pandemic in 2020. Additionally, technology such as online instruction and modernizing classrooms has changed since the law was passed and are important for student success.
In recent years, districts have also taken on more responsibility for providing support to students outside of the classroom. During the pandemic, community colleges reported using Higher Education Relief Fund Grants to improve student support services and address students’ basic needs. Support services, such as counseling and library services, help contribute to student success. According to some districts we reviewed, support services have increased over the years with the changing needs of students and are important for improving student success in the classroom. Basic needs services, some of which we list in the text box, ensure that students have the necessary resources, including food and housing. When students’ basic needs are fulfilled, they are more prepared to actively participate in the learning process, accomplish their academic objectives, and focus on their overall welfare. Some districts indicated that students’ needs and the expectations on districts to meet those student needs have changed over time. Students’ basic needs have increased over the years, such as housing and food insecurity, and mental health. Additionally, state law requires college campuses to hire basic needs coordinators. As of January 2024, every community college reported providing basic needs services to students.
Basic Needs Services:
- Housing
- Food
- Clothing
- Feminine Hygiene
- Diapers
- Childcare
- Mental Health
Source: State law.
Funding for Community College Districts
The ways in which districts receive funding vary. Most districts receive an apportionment from the State (state apportionment) in accordance with the Student Centered Funding Formula (SCFF). Generally, the SCFF comprises three allocations that are determined by, among other items, student enrollment numbers; the number of students enrolled who have received a College Promise grant or a Pell Grant; and student success metrics, including the number of students who transfer or graduate. State law directs that a district’s state apportionments be reduced by other types of revenue, such as certain local property tax revenue or enrollment fees. For some districts, the local property tax revenues and other revenues collected by the district exceed the amount of funding they would otherwise receive in state apportionments. In these cases, state law restricts those districts from receiving state apportionment. We refer to these districts as community‑supported districts. Although only eight of the 73 community college districts are currently community‑supported, as the text box shows, three of the four districts that reported noncompliance with the 50 Percent Law in fiscal year 2022–23 were community‑supported.
Eight Districts Are Community Supported and Do Not Receive State Apportionment
- Marin
- MiraCosta
- Napa
- San José
- San Mateo
- Sierra
- South Orange
- West Valley
Source: Districts’ adopted budgets or annual audits.
Legislation That Affects, and Past Attempts to Amend, the 50 Percent Law
Complicating the picture for districts, the 50 Percent Law is not the only law that governs instructor staffing for the CCC. State law generally requires districts to adjust the number of full‑time faculty from the prior year in proportion to changes in student enrollment. This is known as the Faculty Obligation Number (FON). In 1988, the State enacted Assembly Bill 1725, which among other provisions recognized a goal that full‑time instructors teach at least 75 percent of all hours of credit instruction.
During the past two decades, there have been several legislative efforts to modify the 50 Percent Law, none of which succeeded. Assembly Bill 906, introduced in 2007, would have included the salaries of counselors and librarians in Instructor Salaries, and increased the 50 percent allocation to 53 percent. Two bills introduced in 2009, Assembly Bill 581 and Assembly Bill 1157, would have included the salaries of counselors, but not librarians, in Instructor Salaries and adjusted the compliance rate to 52 percent instead of 50 percent. Introduced in 2013, Assembly Bill 806 would have explicitly defined instructional aide salaries and incorporated counselor salaries into Instructor Salaries without providing for any change in the formula’s compliance rate at 50 percent. The most recent attempt was Senate Bill 1039, introduced in 2024, which would have included salaries of counselors and librarians in Instructor Salaries and would have redefined compliance to be when the formula rate equals 60 percent. None of these bills were enacted into law, as Table 1 shows.
Selection of Districts for Review
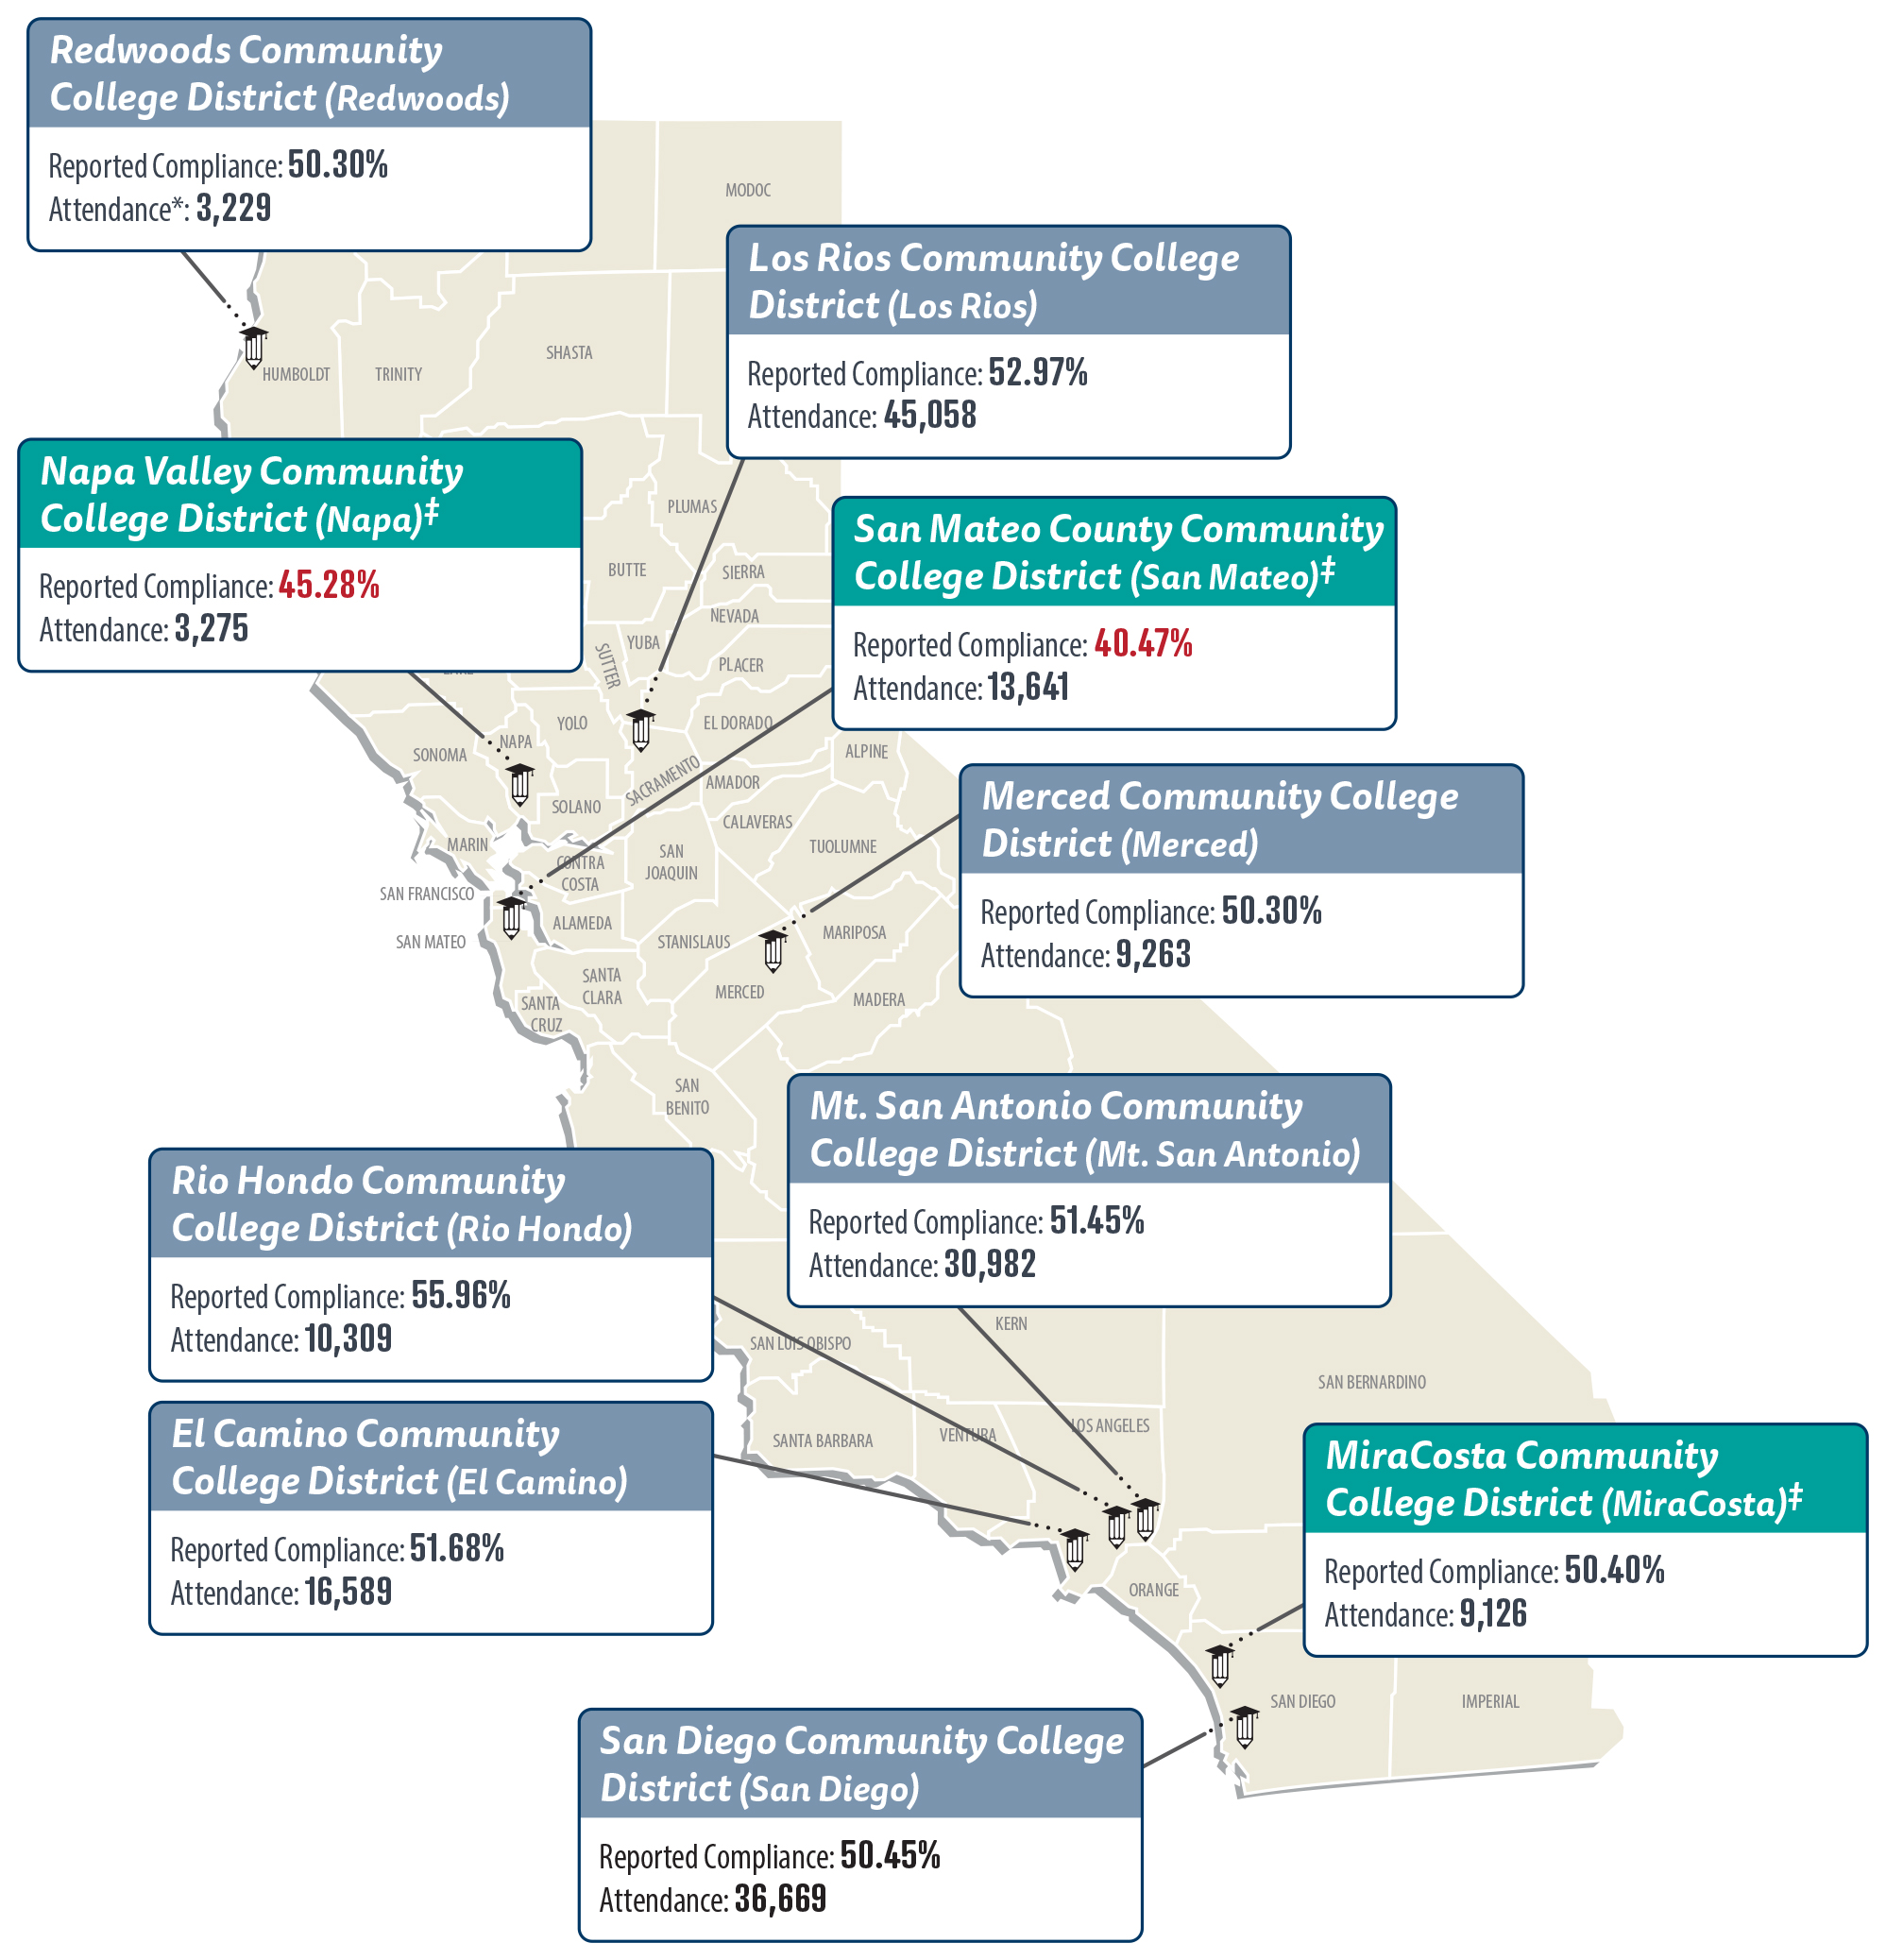
To determine whether districts appropriately reported compliance with the 50 Percent Law, we selected 10 of the 73 districts across the State. As Figure 3 shows, these 10 districts reported varying compliance rates. For example, we selected Rio Hondo, a mid‑sized district in the southern region of the State that reported a compliance rate well above 50 percent, and Redwoods, a small district in the northern area of the State that reported a rate slightly more than 50 percent. Three of the districts we selected—MiraCosta, Napa, and San Mateo—are community‑supported districts and do not receive state apportionment.
Figure 3
The 10 Districts We Reviewed Reported Varying Compliance Rates in Fiscal Year 2022–23
Source: Chancellor’s Office 50 percent compliance reports for 2022–23, Apportionment Attendance Reports for 2022–23, and districts’ annual audit reports.
Note: Refer to Table 4 for the adjusted compliance rates of districts in whose reporting we found errors that would result in noncompliance.
* To determine attendance, we used full‑time equivalent students that districts reported to the Chancellor’s Office in its Apportionment Attendance Reports in fiscal year 2022–23.
‡ Community–supported districts receive their funding from sources other than the state apportionment, including local property taxes.
This figure is a map of California showing 10 community college districts we selected for review and their reported compliance rates and student attendance numbers for fiscal year 2022-23. Specifically, from the north of California to the south, the graphic shows Redwoods with a 50.30 percent reported compliance rate and 3,229 student attendance, Napa with a 45.28 percent reported compliance rate and 3,275 student attendance, Los Rios with a 52.97 percent reported compliance rate and 45,058 student attendance, San Mateo with a 40.47 percent reported compliance rate and 13,641 student attendance, Merced with a 50.30 percent reported compliance rate and 9,263 student attendance, Mt. San Antonio with a 51.45 percent reported compliance rate and 30,982 student attendance, Rio Hondo with a 55.96 percent reported compliance rate and 10,309 student attendance, El Camino with a 51.68 percent reported compliance rate and 16,589 student attendance, MiraCosta with a 50.40 percent reported compliance rate and 9,126 student attendance, and San Diego with a 50.45 percent reported compliance rate and 36,669 student attendance.
Issues
The 50 Percent Law Limits Districts’ Ability to Fund Services Outside of the Classroom That Support Student Success
The Chancellor’s Office’s Limited Oversight Allowed Multiple Districts to Inaccurately Report Their Compliance Rates
Available Data Indicate That Districts’ Investment in Administrators Has Increased at a Greater Rate Than Their Investment in Faculty
The 50 Percent Law Limits Districts’ Ability to Fund Services Outside of the Classroom That Support Student Success
Key Points
- Complying with the 50 Percent Law may impede districts’ efforts to provide services that support student success. Amending the 50 Percent Law to include the salaries of support service personnel, such as counselors and librarians, in Instructor Salaries for the 50 percent calculation could further support student success.
- Most districts reported that basic needs services spending did not significantly affect their compliance with the 50 Percent Law. If the Chancellor’s Office were to amend the accounting manual to include an accounting code for basic needs services expenses, districts could consistently track their basic needs services spending.
The Legislature Could Amend the 50 Percent Law to Better Support Student Success
Spending 50 percent of their Current Educational Expenses on Instructor Salaries, as the 50 Percent Law requires, may limit districts’ ability to spend on other services that support student success. As we discuss in the Introduction, there have been significant changes in the delivery of education and student needs since the passage of the 50 Percent Law in 1961. Specifically, support services outside of the classroom, such as counseling and library services, and changes in technology play larger roles in student success today than they did when the State implemented the 50 Percent Law more than 60 years ago. The Senate fact‑finding committee report, upon which the 50 Percent Law was based, proposed legislation that sought to establish guidelines for spending state funds for instructor salaries, with the goal of reducing class sizes and improving student outcomes. The report stated that its proposed legislation would place a ceiling on state money spent outside of the classroom.
However, neither we nor the Chancellor’s Office identified any provision of state law requiring districts to report individual class size to the Chancellor’s Office or the CCC Board of Governors. In the absence of this requirement to report class size, it is difficult to know whether the 50 Percent Law has caused a decrease in community colleges’ class sizes. Although there is no metric to compare to actual class size, to respond to the Audit Committee’s calling for us to report staffing as totals and ratios, we present ratios of students to faculty. According to the Chancellor’s Office’s statewide data, the ratio of students to faculty has decreased from 33.65 students per faculty member in fiscal year 2012–13, to 29.23 students per faculty in fiscal year 2023–24, as Appendix A shows. However, the category of faculty in the statewide data include more than just individuals performing classroom instruction. The faculty category includes other personnel, such as counselors and librarians, so using this as a metric to determine class size can be misleading. Several additional factors could also affect ratios of students to faculty, such as other state laws and student enrollment numbers.
The 50 Percent Law does not contain any requirements for ensuring that the amount that the districts spend on Instructor Salaries will decrease class sizes. For example, the 50 Percent Law contains no provisions governing the number of instructors or the ratio of students to faculty that community colleges must maintain. As a result, districts can comply with the 50 Percent Law by simply increasing salaries for its current instructors rather than hiring additional instructors. Therefore, compliance with the 50 Percent Law may neither lead to an increase in the number of instructors at a district, nor does it necessarily affect a district’s average class size.
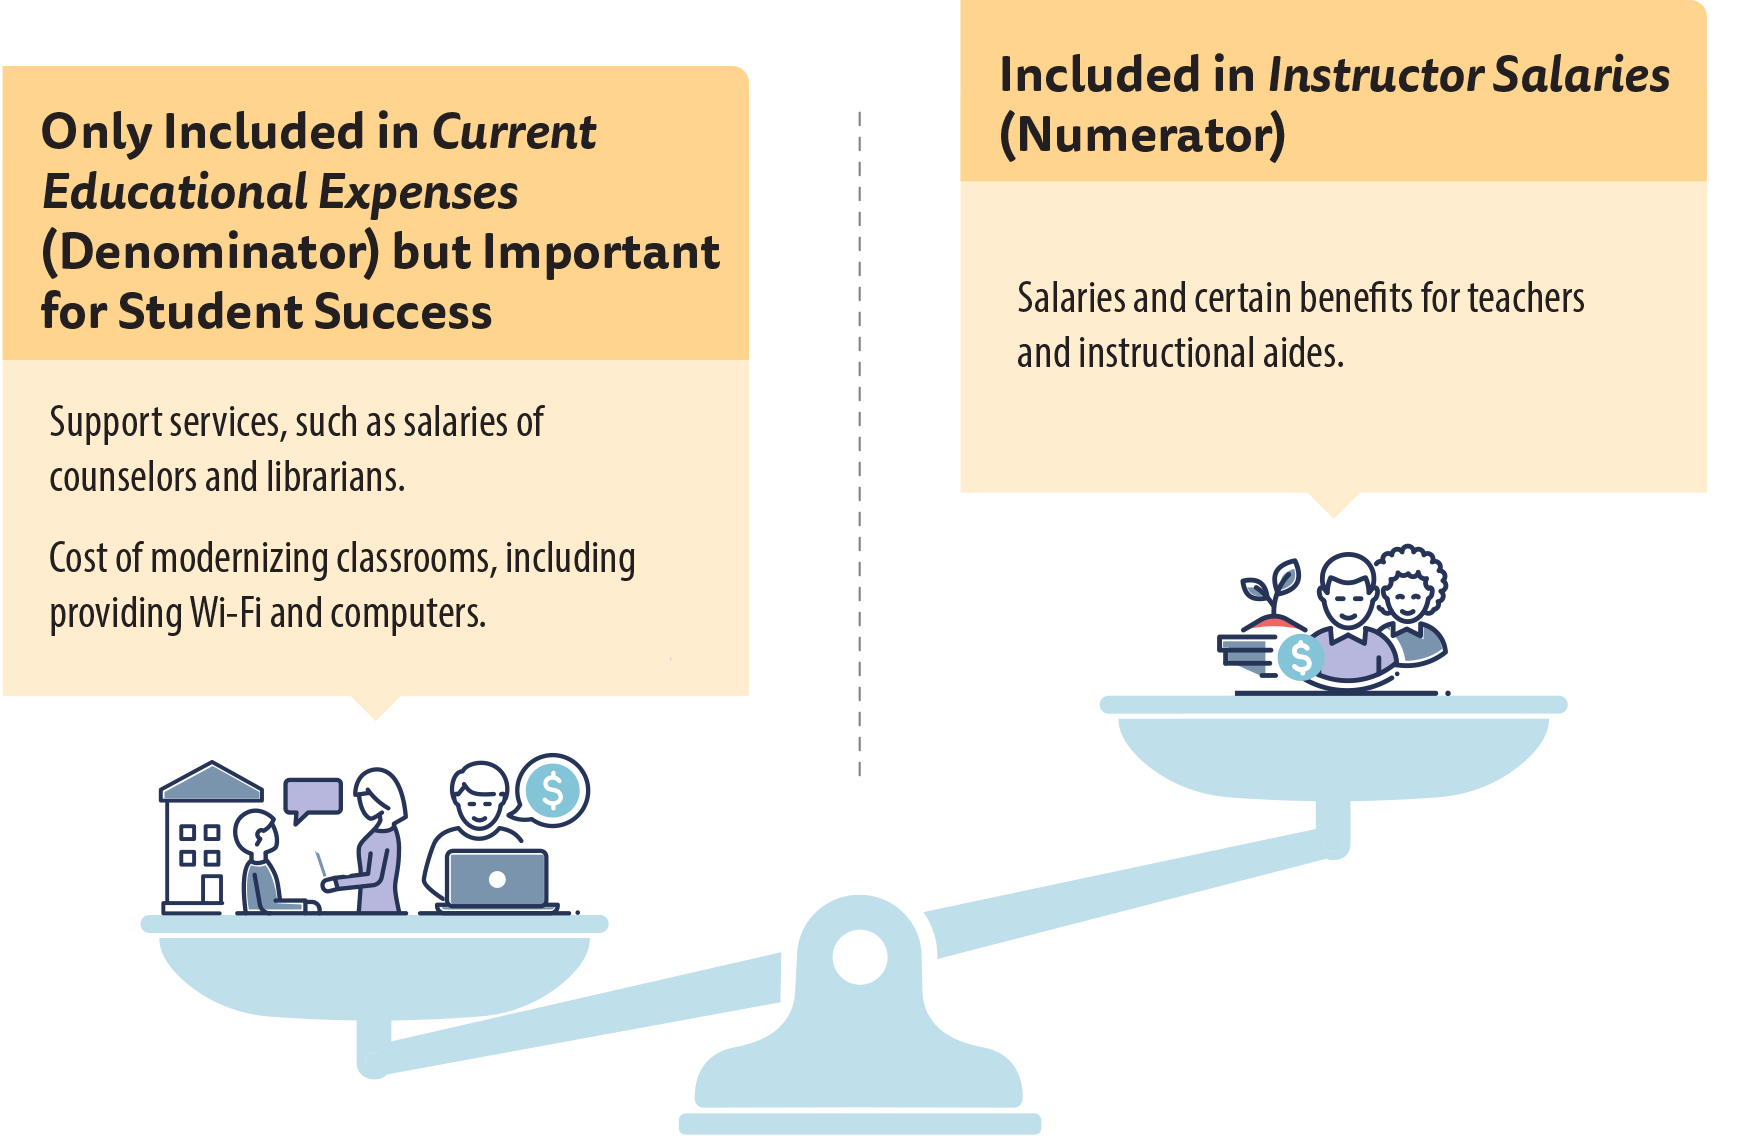
Districts must weigh complying with the 50 Percent Law against providing other services that support student success, as Figure 4 shows. Students benefit from services that take place outside of classroom instruction, such as counseling. For example, our September 2024 report, California’s Systems of Public Higher Education: Streamlining the Community College Transfer Process Could Increase Access to Bachelor’s Degrees, Report 2023-123, discusses the importance of counseling services for transfer‑intending students. Because the 50 Percent Law does not allow a district to include as Instructor Salaries the portion of a salary that is related to counseling, hiring counselors can make it difficult for districts to comply with the law. Additionally, expenses for other types of support services personnel who support student success, such as librarians, are included as Current Educational Expenses in the 50 percent calculation but not as Instructor Salaries.
Figure 4
Districts Must Weigh Complying With the 50 Percent Law Against Spending on Other Services That Support Student Success
Source: Academic Senate for CCC documents, CCC website, district personnel, and state law.
This figure is a scale showing on the left expenses that are important for student success, such as the salaries of counselors and librarians and the cost of modernizing classrooms including providing Wi-Fi and computers and are only included in Current Educational Expenses or the denominator. On the right, and higher on the scale than the expenses on the left, are the expenses included in Instructor Salaries or the numerator, which only include the salaries and certain benefits for teachers and instructional aides.
The 50 Percent Law also does not account for improvements in technology, such as online instruction and the modernization of classrooms, which may play a large role in student success. District technology and infrastructure have significantly changed since the law passed and online learning has become more common, which necessitates the increased use of technology. However, certain expenses for these technological improvements are also included in Current Educational Expenses but not as Instructor Salaries. In other words, if districts increase expenses for these support services and technology, which are included in the denominator of the 50 percent formula, it makes it more difficult for districts to comply with the 50 Percent Law. Several districts we reviewed explained that they have to weigh priorities, such as increasing support services and modernizing classrooms, with complying with the 50 Percent Law.
Including certain support service personnel in Instructor Salaries in the 50 percent calculation could have a positive impact on districts’ compliance rates. To determine the potential effect of including support services as Instructor Salaries, we identified two accounting codes that districts used for counseling and library services and we obtained the related data. We used the data the districts provided to us to recalculate districts’ reported compliance rates to determine its effect, as Table 2 shows. Including support services in Instructor Salaries in the 50 percent calculation could increase compliance rates across the 10 districts we reviewed by 2.06 to 5.64 percentage points.2 However, because we did not perform an assessment of this information’s reliability and because of the limitations that footnote 2 describes, the percentage difference is not precise.
Nevertheless, several of the 10 districts we reviewed indicated that an improvement to the 50 Percent Law would be to include support service personnel, such as counselors and librarians, in Instructor Salaries in the 50 percent calculation. Representatives of faculty unions and academic senates that we spoke with also expressed openness to this change. However, these stakeholders asserted that if support service personnel, such as counselors and librarians are included in Instructor Salaries, the compliance rate should be increased above 50 percent. The representatives explained that increasing the compliance rate above 50 percent would allow districts to hire more faculty without taking away from the funding towards classroom instruction.
However, some of the districts we spoke with indicated that the compliance rate should not be increased. These districts explained that increasing the compliance rate would put more pressure on strained budgets to comply with the law. The Legislature could consider amending the law to include the salaries and benefits of support service personnel in Instructor Salaries, and if it does, it could consider increasing the required compliance rate as well. The Legislature could also consider allowing districts to exclude technology expenses related to instruction from the 50 percent calculation. In doing so, and if it passes legislation to address these considerations, the Legislature would help ensure that districts are able to invest in student support services while still complying with the required spending on instructors.
Most Districts That Track the Costs of Basic Needs Services Reported That Such Spending Had Only a Negligible Effect on Their Compliance With the 50 Percent Law
Although not directly included in our audit objectives, the Legislature asked that we review the effect that providing basic needs services and resources (basic needs services) has on districts’ ability to comply with the 50 Percent Law. Basic needs services can include, but are not limited to, food, housing, clothing, childcare, and mental health support. Access to basic needs services is important for student success. Although the districts we reviewed inconsistently tracked information on basic needs services spending, most districts reported spending on basic needs services and reported that spending on basic needs services does not significantly affect their compliance with the 50 Percent Law.
The Chancellor’s Office’s accounting manual—which state law requires districts to follow—does not fully prescribe how districts should account for all basic needs services. Instead, the accounting manual states that, for certain programs, districts should identify and keep separate records of the receipt and expenditure of funds, and for other programs, districts may need to maintain detailed records to fulfill reporting requirements of other funding agencies. Because the accounting manual does not include a specific accounting code to track basic needs spending or specify which programs districts should include in the category of basic needs services, districts did not consistently track expenses for them, limiting our ability to report consistent information for the 10 districts we reviewed.
The amount of information each district was able to provide varied greatly, as did the districts’ approaches for tracking expenses for basic needs services. We asked each of the districts we reviewed to provide us with funding information for its spending on the basic needs services it provides to students. Nine of the 10 districts we reviewed were able to provide some information on basic needs spending, although not all could provide spending for both restricted and unrestricted funding sources. Of the nine districts that provided information, some provided expenses for one specific program but others provided spending for multiple programs that they considered to fall under basic needs services. For example, MiraCosta provided us with information for one specific program—Campus Assessment, Resources and Education program—which provides a holistic approach to help students succeed while addressing any challenges they may be experiencing in meeting their basic needs such as food, housing, transportation, mental health support, and childcare. In contrast, El Camino provided us with information related to several programs, such as the CalFresh Outreach Program, Student Food and Housing Support, Basic Needs Center, and Hunger‑Free Campus. Four districts—Merced, Napa, Rio Hondo, and Redwoods—could provide information about their spending on basic needs services from restricted funds but could not for such spending from the unrestricted general fund. Mt. San Antonio indicated that it provided expenses related to restricted funding programs specific to basic needs, but there are other restricted funding programs that it uses to provide basic needs services that are not included in the amounts provided due to the complexity of tracking those expenditures. San Diego could not provide information on basic needs services spending from either funding source. The district explained that it is difficult to show precisely how much it spent on basic needs services because such spending is spread across several accounting codes that are also used for other expenses.
Although districts reported information inconsistently, most districts indicated that they pay for their basic needs services programs primarily using restricted funds. Because the 50 percent calculation excludes expenses from restricted funds, the spending on these services does not affect districts’ compliance with the 50 Percent Law. For example, El Camino indicated that its basic needs services were funded exclusively using restricted funds. Further, San Diego, which could not provide basic needs services data to us, indicated that basic needs services are currently funded almost exclusively through restricted funds.
Districts we reviewed reported that their basic needs services spending from the unrestricted general fund could make up as much as 0.47 percent of the Current Educational Expenses or the denominator, as Table 3 shows. Some districts—for example, Los Rios and Mt. San Antonio—indicated that they spent unrestricted funding on basic needs services, which the 50 percent calculation includes, and basic needs services were 0.13 percent and 0.09 percent of the Current Educational Expenses that year, respectively. Further, MiraCosta indicated that 34 percent of its spending on basic needs services in fiscal year 2022–23 was from its unrestricted fund. This spending was 0.26 percent of the Current Educational Expenses of the 50 percent calculation in fiscal year 2022–23.
Because of inconsistencies in the data the districts provided, the Chancellor’s Office should update the accounting manual to fully prescribe how districts should account for basic needs services spending. This should include an accounting code for basic needs services and specify which basic needs services districts should classify under this code. Because of the importance of basic needs services for students, and the Legislature’s interest in the impact of basic needs services on districts’ compliance with the 50 Percent Law, districts should track this information. Further, some districts we reviewed indicated that if restricted funds become less available, districts may need to cut services, find other restricted funding, or use unrestricted funding, which could impact their compliance with the 50 Percent Law. When the Chancellor’s Office updates its accounting manual to specify how districts should track spending on basic needs services, the Legislature could require the Chancellor’s Office to report that data to it to better understand whether providing basic needs services will have a larger impact on their compliance with the 50 Percent Law.
The Chancellor’s Office’s Limited Oversight Allowed Multiple Districts to Inaccurately Report Their Compliance Rates
Key Points
- From fiscal years 2018–19 through 2022–23, only five of the 73 districts reported noncompliance with the 50 Percent Law.
- Insufficient guidance from the Chancellor’s Office may have caused some districts to inaccurately report their compliance with the 50 Percent Law.
- Because most noncompliant districts are community supported, and do not receive funding through state apportionment, the Chancellor’s Office lacks a viable enforcement mechanism to hold noncompliant districts accountable.
Most Districts Reported Having Complied With the 50 Percent Law
From fiscal years 2018–19 through 2022–23, 68 of the 73 districts reported to the Chancellor’s Office that they had complied with the 50 Percent Law in all five years, as Appendix B shows. Among the districts with the lowest compliance rates were San Mateo with 40.47 percent and Napa with 45.28 percent in fiscal year 2022–23. The districts with the highest reported compliance rates in fiscal year 2022–23 were Lassen with 58.65 percent and Feather River with 60.07 percent. The only districts that reported noncompliance with the 50 Percent Law in at least one of the last five fiscal years were Calbright, Contra Costa, Marin, Napa, and San Mateo.
Although the districts generally report having complied with the law, all compliance is self‑reported by the districts to the Chancellor’s Office. State law requires the Chancellor’s Office to determine each districts’ 50 percent calculation based on the district’s reporting. By October 10 of each year, districts must submit to the Chancellor’s Office their annual financial and budget reports (financial reports). These financial reports include the dollar amounts districts report in Instructor Salaries, or the numerator of the calculation formula, and in the Current Educational Expenses, or the denominator of the calculation formula, and the amounts that districts exclude from the 50 percent calculation, such as expenditures from certain categorical or restricted funds. The Chancellor’s Office indicated that it relies on annual Certified Public Accountant (CPA) audits to gain confidence in the accuracy of the financial reports, including the 50 percent calculation, the districts submit.
Districts may adjust their financial reporting to achieve compliance with the 50 Percent Law. Some of the districts we reviewed adjusted their expense allocations, such as by moving expenses from the unrestricted general fund to a restricted or categorical funding source, which can help increase their 50 percent compliance rate by lowering the denominator. This included changing the funding source for previous purchases of instructional materials or utility payments to pay for the transactions from a restricted or categorical fund, which would remove the expense from Current Educational Expenses, or the denominator, and thereby increase their compliance rate by lowering the denominator of the calculation. These types of adjustments are allowable provided they conform to applicable law. The Chancellor’s Office provides guidance to districts that includes suggestions and guidelines to “fine tune” their 50 Percent Law reporting. This includes guidance on budgeting and charging costs to restricted funds, among other things. For example, the guidance directs districts to charge appropriate noninstructional costs to grants to move those expenditures to restricted funds, if those grants allow those types of expenditures. To ensure that districts achieve compliance—such as when a district is only a few percentage points below the required compliance rate—districts can use the guidance the Chancellor’s Office provides to fine tune their 50 percent calculation to ensure optimal use of the funds available to them.
The Chancellor’s Office’s Inadequate Oversight Allowed Seven of 10 Districts We Reviewed to Inaccurately Report Their Compliance Rate
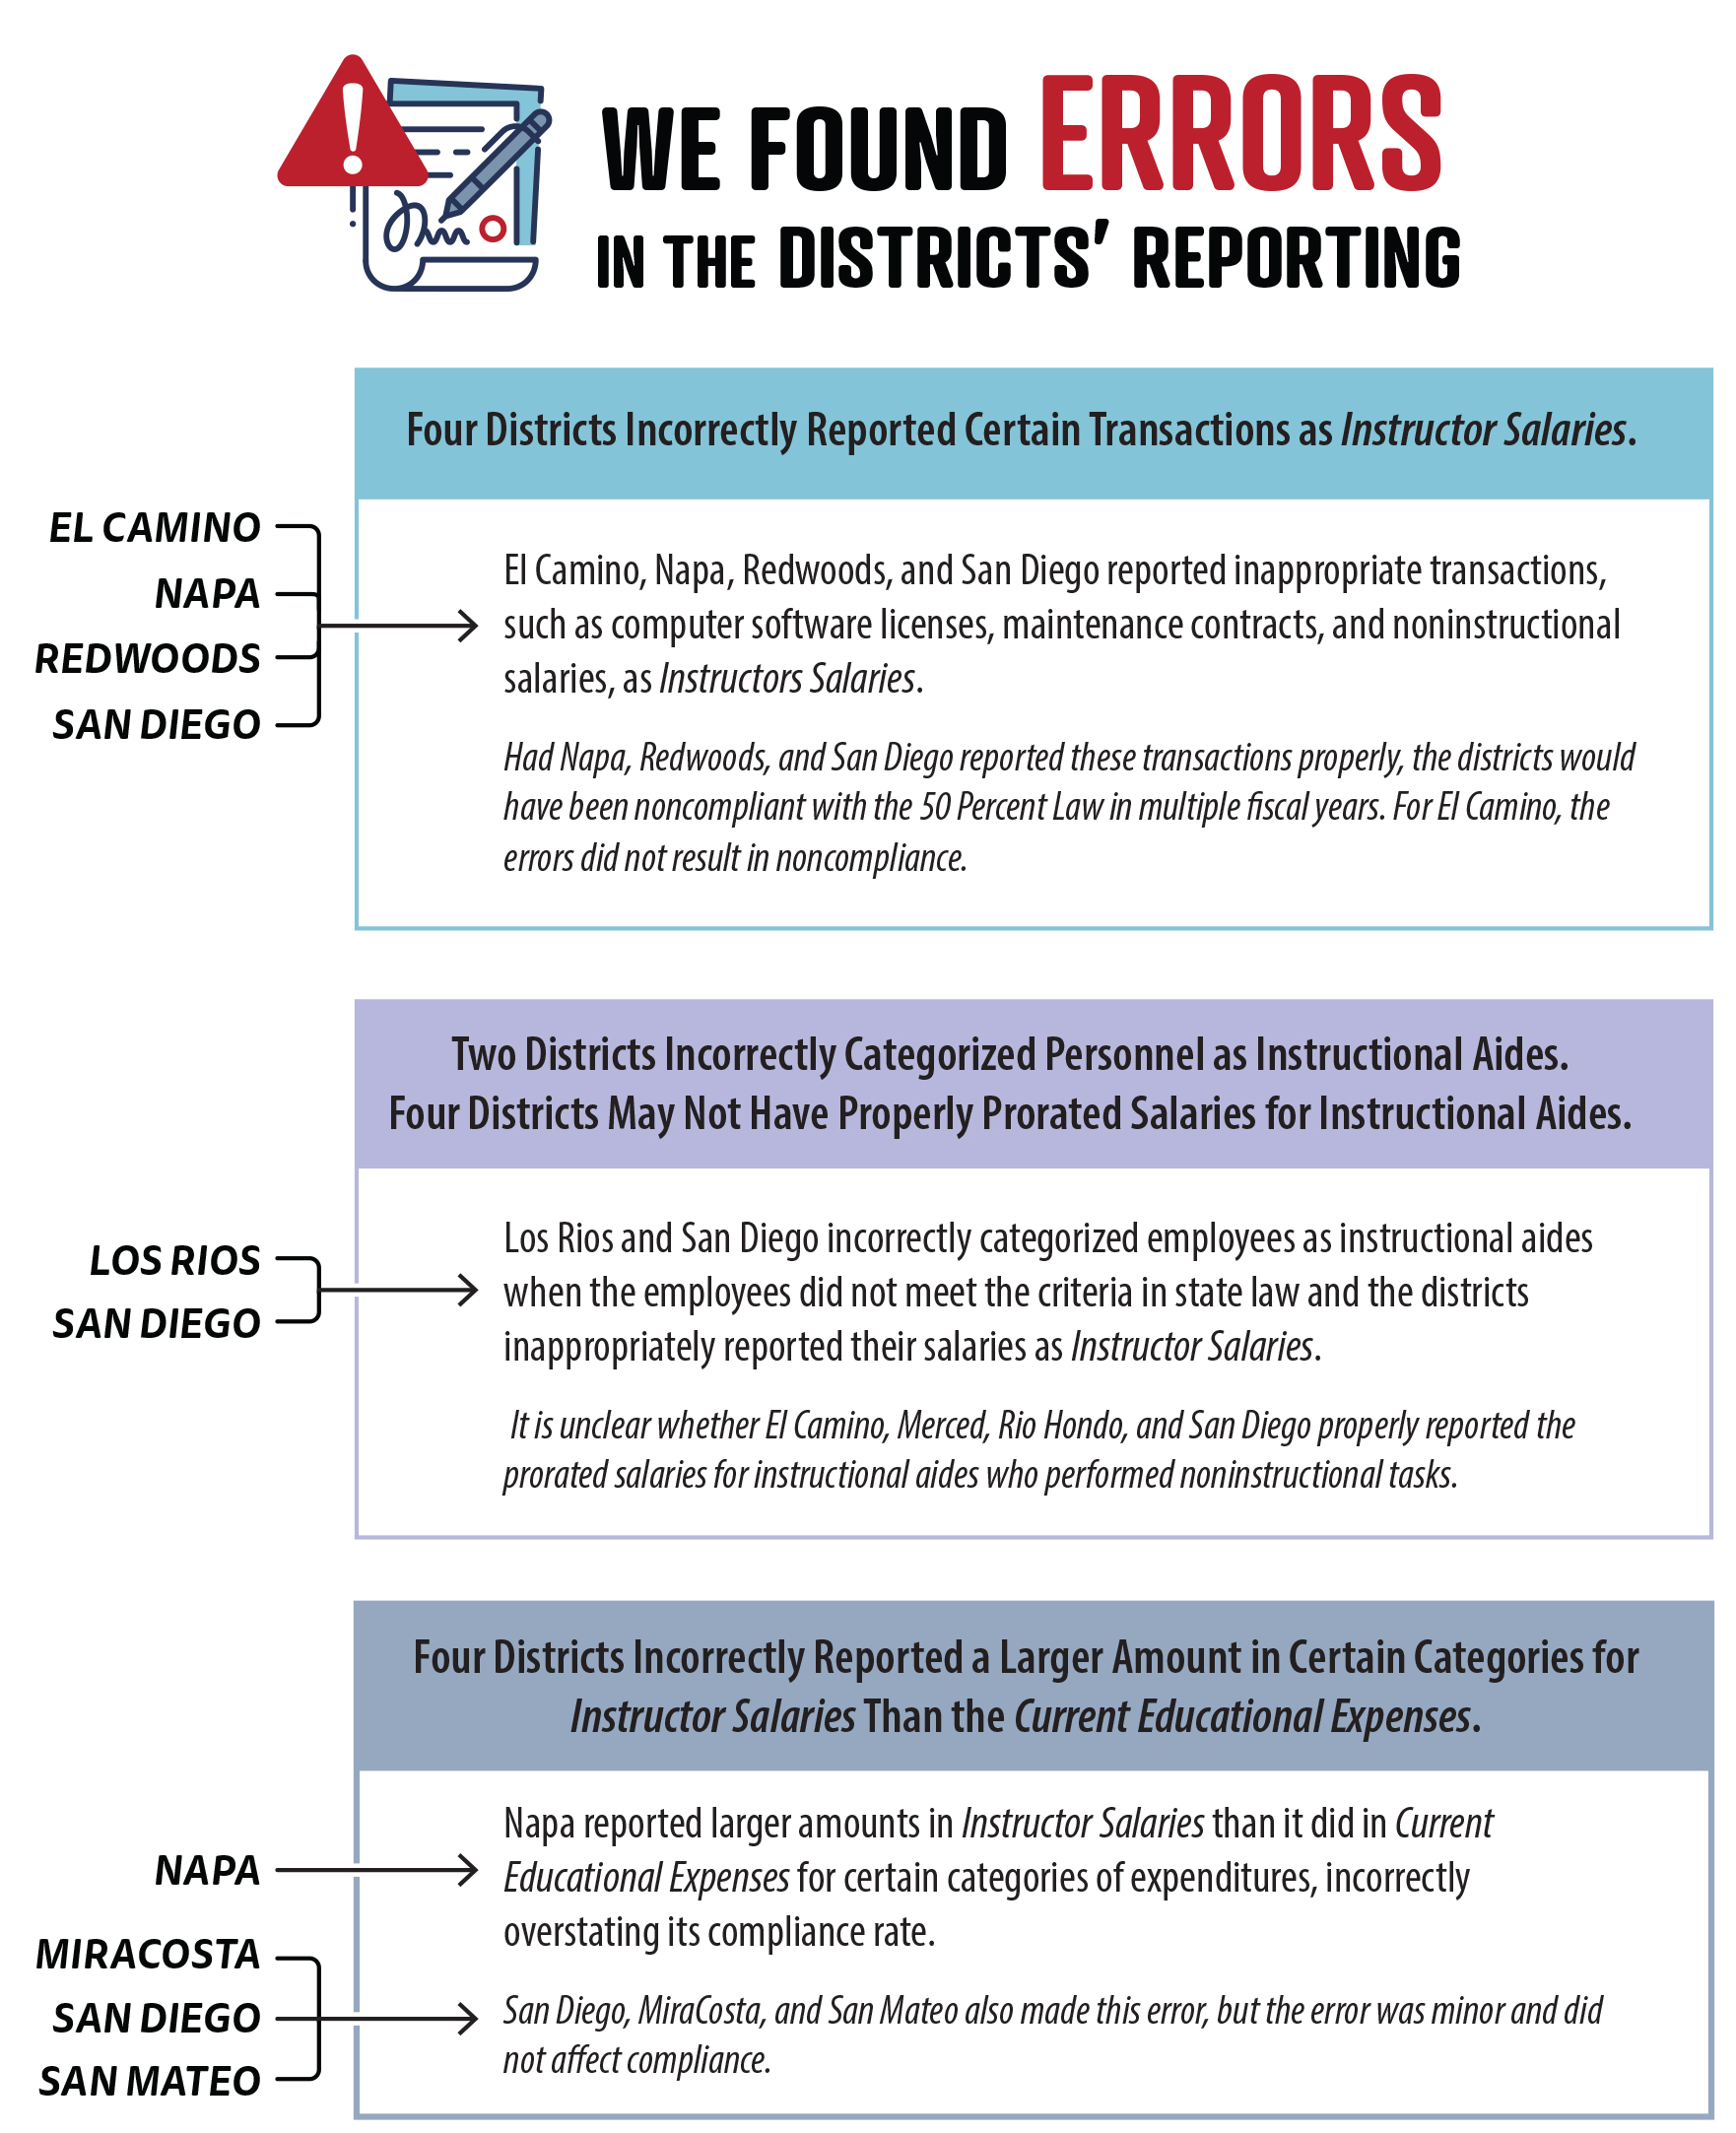
For the 10 districts we selected to determine whether they accurately reported their compliance with the 50 Percent Law, we reviewed a selection of 30 transactions that took place during five fiscal years at each of the 10 districts, for a total of 300 transactions.3 We selected transactions from different reporting categories, such as salaries related to instructional personnel and noninstructional personnel—like administrators and instructional aides—and other operating expenses. We also reviewed the calculations the districts used when producing their financial reports from fiscal years 2018–19 through 2022–23 to determine whether they reported their compliance with the 50 Percent Law accurately to the Chancellor’s Office. Our review identified three types of errors in the districts’ reporting of their compliance with the 50 Percent Law, which we describe in Figure 5. Although the errors we identified in the districts’ reporting resulted in districts overstating their compliance rates, not all errors resulted in large enough changes to affect their compliance with the 50 Percent Law.
Figure 5
Although Most Districts Report Compliance With the 50 Percent Law, Seven Districts We Reviewed Had Errors in Their Reporting
Source: Districts’ accounting records, supporting documentation, and 50 Percent Law compliance reports.
This figure depicts three boxes which describe the types of errors we found in districts’ reporting. The top box shows that El Camino, Napa, Redwoods, and San Diego reported inappropriate transactions, such as computer software licenses, maintenance contracts, and noninstructional salaries as Instructor Salaries. Had Napa, Redwoods, and San Diego reported these transactions properly, the districts would have been noncompliant with the 50 Percent Law in multiple fiscal years. For El Camino, the errors did not result in noncompliance. The second box shows that multiple districts incorrectly reported instructional aide expenses. Specifically, Los Rios and San Diego incorrectly categorized employees as Instructional Aides when the employees did not meet the criteria in state law and the districts inappropriately reported their salaries as Instructor Salaries. The second box also includes a statement that it is unclear whether El Camino, Merced, Rio Hondo, and San Diego properly reported the prorated salaries for Instructional Aides who performed noninstructional tasks. The third box shows that Napa reported amounts in certain categories for Instructor Salaries that were larger than the amounts it reported for Current Educational Expenses, contributing to the district falling out of compliance. San Diego, MiraCosta, and San Mateo also made this error, but the error was minor and did not affect compliance.
Insufficient Training by the Chancellor’s Office Led to Four Districts Incorrectly Reporting Certain Transactions as Instructor Salaries
As we show in the first error type in Figure 5, four districts—El Camino, Napa, Redwoods, and San Diego—incorrectly reported certain transactions as Instructor Salaries—or the numerator—of the 50 percent formula. Had the districts reported these transactions correctly, three of the districts would have been noncompliant with the 50 Percent Law. Districts report transactions into different categories when submitting their financial reports. One reporting category is Other Operating Expenses, which includes transactions for items such as contract services, utilities, and insurance. However, districts are only allowed to include some of these transactions in Instructor Salaries, or the numerator. Specifically, the Chancellor’s Office’s guidance indicates that only direct instructional costs associated with Instructional Service Agreements (ISA) from the Other Operating Expenses category should be included as Instructor Salaries. ISAs are contracts between a district and a public or private entity to provide courses to enrolled students, such as a district contracting with a local fire department to provide fire science training. However, El Camino, Napa, and Redwoods included transactions that did not meet these criteria for inclusion in Instructor Salaries, such as expenses for computer software licenses and maintenance contracts. Redwoods explained that it did not know that only direct instructional costs associated with ISAs should be included as Instructor Salaries. El Camino explained that the guidance from the Chancellor’s Office permits this type of reporting.
We reviewed the guidance and direction that the Chancellor’s Office’s provides to districts. Specifically, we reviewed the guidance the Chancellor’s Office provides to districts on how to report the Other Operating Expenses reporting category of Instructor Salaries on its website and the form the Chancellor’s Office created for districts to use in their financial reporting. Both the Chancellor’s Office’s website and the form specify that the only transactions districts can report as Instructor Salaries for the Other Operating Expenses reporting category are direct instructional costs associated with ISAs. A fiscal standards and accountability community college specialist (fiscal specialist) from the Chancellor’s Office also confirmed that districts should report only direct instructional costs associated with ISAs as Instructor Salaries. However, since Redwoods did not know the criteria for this reporting category and El Camino believed their reporting error was permissible, the guidance needs to be clearer and more training needs to be provided to districts to ensure that the districts are accurately reporting transactions for this category.
Another category of transactions that districts report as part of their financial reports is “Instructional Aides.” This category includes salaries for instructional aides, which districts may report as Instructor Salaries only for performing instructional tasks. As we discuss later, the Chancellor’s Office has not provided the districts with specific guidance about what constitutes “instructional tasks.” However, if an instructional aide performs a noninstructional task, then the districts should not report as Instructor Salaries the salary for that portion of the instructional aide’s work. One district—San Diego—reported instructional aide salaries as Instructor Salaries even though the district categorized the tasks those individuals performed as noninstructional, which the 50 Percent Law does not allow. For example, the district incorrectly reported tasks for institutional support services as Instructor Salaries. San Diego explained that it reported these transactions as Instructor Salaries based on training and guidance it received from its independent auditors and the Association for Chief Business Officials (ACBO).4 However, a fiscal specialist at the Chancellor’s Office indicated that this type of error would lead to inaccurate reporting.
We recalculated the four districts’ compliance rates taking into account these errors. We found that the compliance rates for three districts—Redwoods, Napa, and San Diego—fell below 50 percent in multiple fiscal years we reviewed, as Table 4 shows. The compliance rate for the fourth district—El Camino—remained above 50 percent. When we presented our conclusions to the districts, Redwoods and San Diego claimed that if the errors had been identified before they submitted their financial reports, they would have met compliance by adjusting other expenditures.
Two Districts Incorrectly Categorized Some Personnel as Instructional Aides, and Four Districts May Not Have Prorated Salaries for Instructional Aides for Noninstructional Tasks
During our testing of transactions at the 10 districts, we found that two districts incorrectly categorized noninstructional personnel as instructional aides, reporting their salaries as Instructor Salaries. The text box shows requirements in state law for a district to categorize personnel as instructional aides and to report their salaries as Instructor Salaries. San Diego and Los Rios were unable to demonstrate that transactions for instructional aides we tested met these criteria. For example, two transactions at Los Rios listed employees with the job title “senior IT technician,” and those employees’ job descriptions primarily describe technology support tasks. This job title neither designates the employee as an instructional aide nor denotes that the employee performs instructional tasks. As a result of these errors, the districts’ reporting to the Chancellor’s Office was inaccurate. For Los Rios and San Diego, these errors were not significant enough to cause the district’s compliance rate to fall below 50 percent for the years in which the transactions occurred.
Criteria for Reporting Instructional Aide Salaries as Instructor Salaries
1. Employee is assigned the basic title of “Instructional Aide” or other appropriate title that denotes that the employee’s duties include instructional tasks,
And
2. Employee is employed to assist instructors in the performance of their duties, in the supervision of students, and in the performance of instructional tasks,
And
3. The portion of instructional aide salaries for performing noninstructional tasks must be prorated and excluded from Instructor Salaries.
Source: State law.
In the absence of clear guidance from the Chancellor’s Office, we cannot determine whether four districts appropriately prorated the salaries of instructional aides for what appears to be noninstructional tasks as Instructor Salaries. As we explained previously, state law directs that the salaries of instructional aides who perform instructional tasks may be reported as Instructor Salaries. However, districts must prorate and exclude from Instructor Salaries the portion of their salaries for performing noninstructional tasks. In our testing, we identified that instructional aides at El Camino, Merced, Rio Hondo, and San Diego had job duties that may include noninstructional tasks. For example, two transactions at El Camino listed several employees with the job title “toolroom/instructional equipment technician,” but those employees’ job descriptions included various tasks that appear to be noninstructional, such as providing input during budget preparation and researching vendors when purchasing new and replacement equipment. However, the districts did not prorate the salaries of these instructional aides for their time spent on noninstructional tasks. Instead, the districts reported the entire salaries of these employees as Instructor Salaries.
We asked the Chancellor’s Office for clarification about its guidance related to these instructional aides and their time spent on noninstructional tasks. The Chancellor’s Office’s legal counsel explained that the determination of an employee’s instructional tasks is left to the discretion of the district. The legal counsel also stated that whether activities are instructional or noninstructional in nature would have to be determined by the totality of the circumstances given the particular employee’s job description. The Chancellor’s Office’s lack of guidance on what constitutes a noninstructional task could lead districts to incorrectly or inconsistently report instructional aide salaries for noninstructional tasks as Instructor Salaries, thereby incorrectly increasing their compliance rate.
Because the Chancellor’s Office Does Not Review Financial Reports, It Did Not Identify Four Districts’ Incorrect Reporting
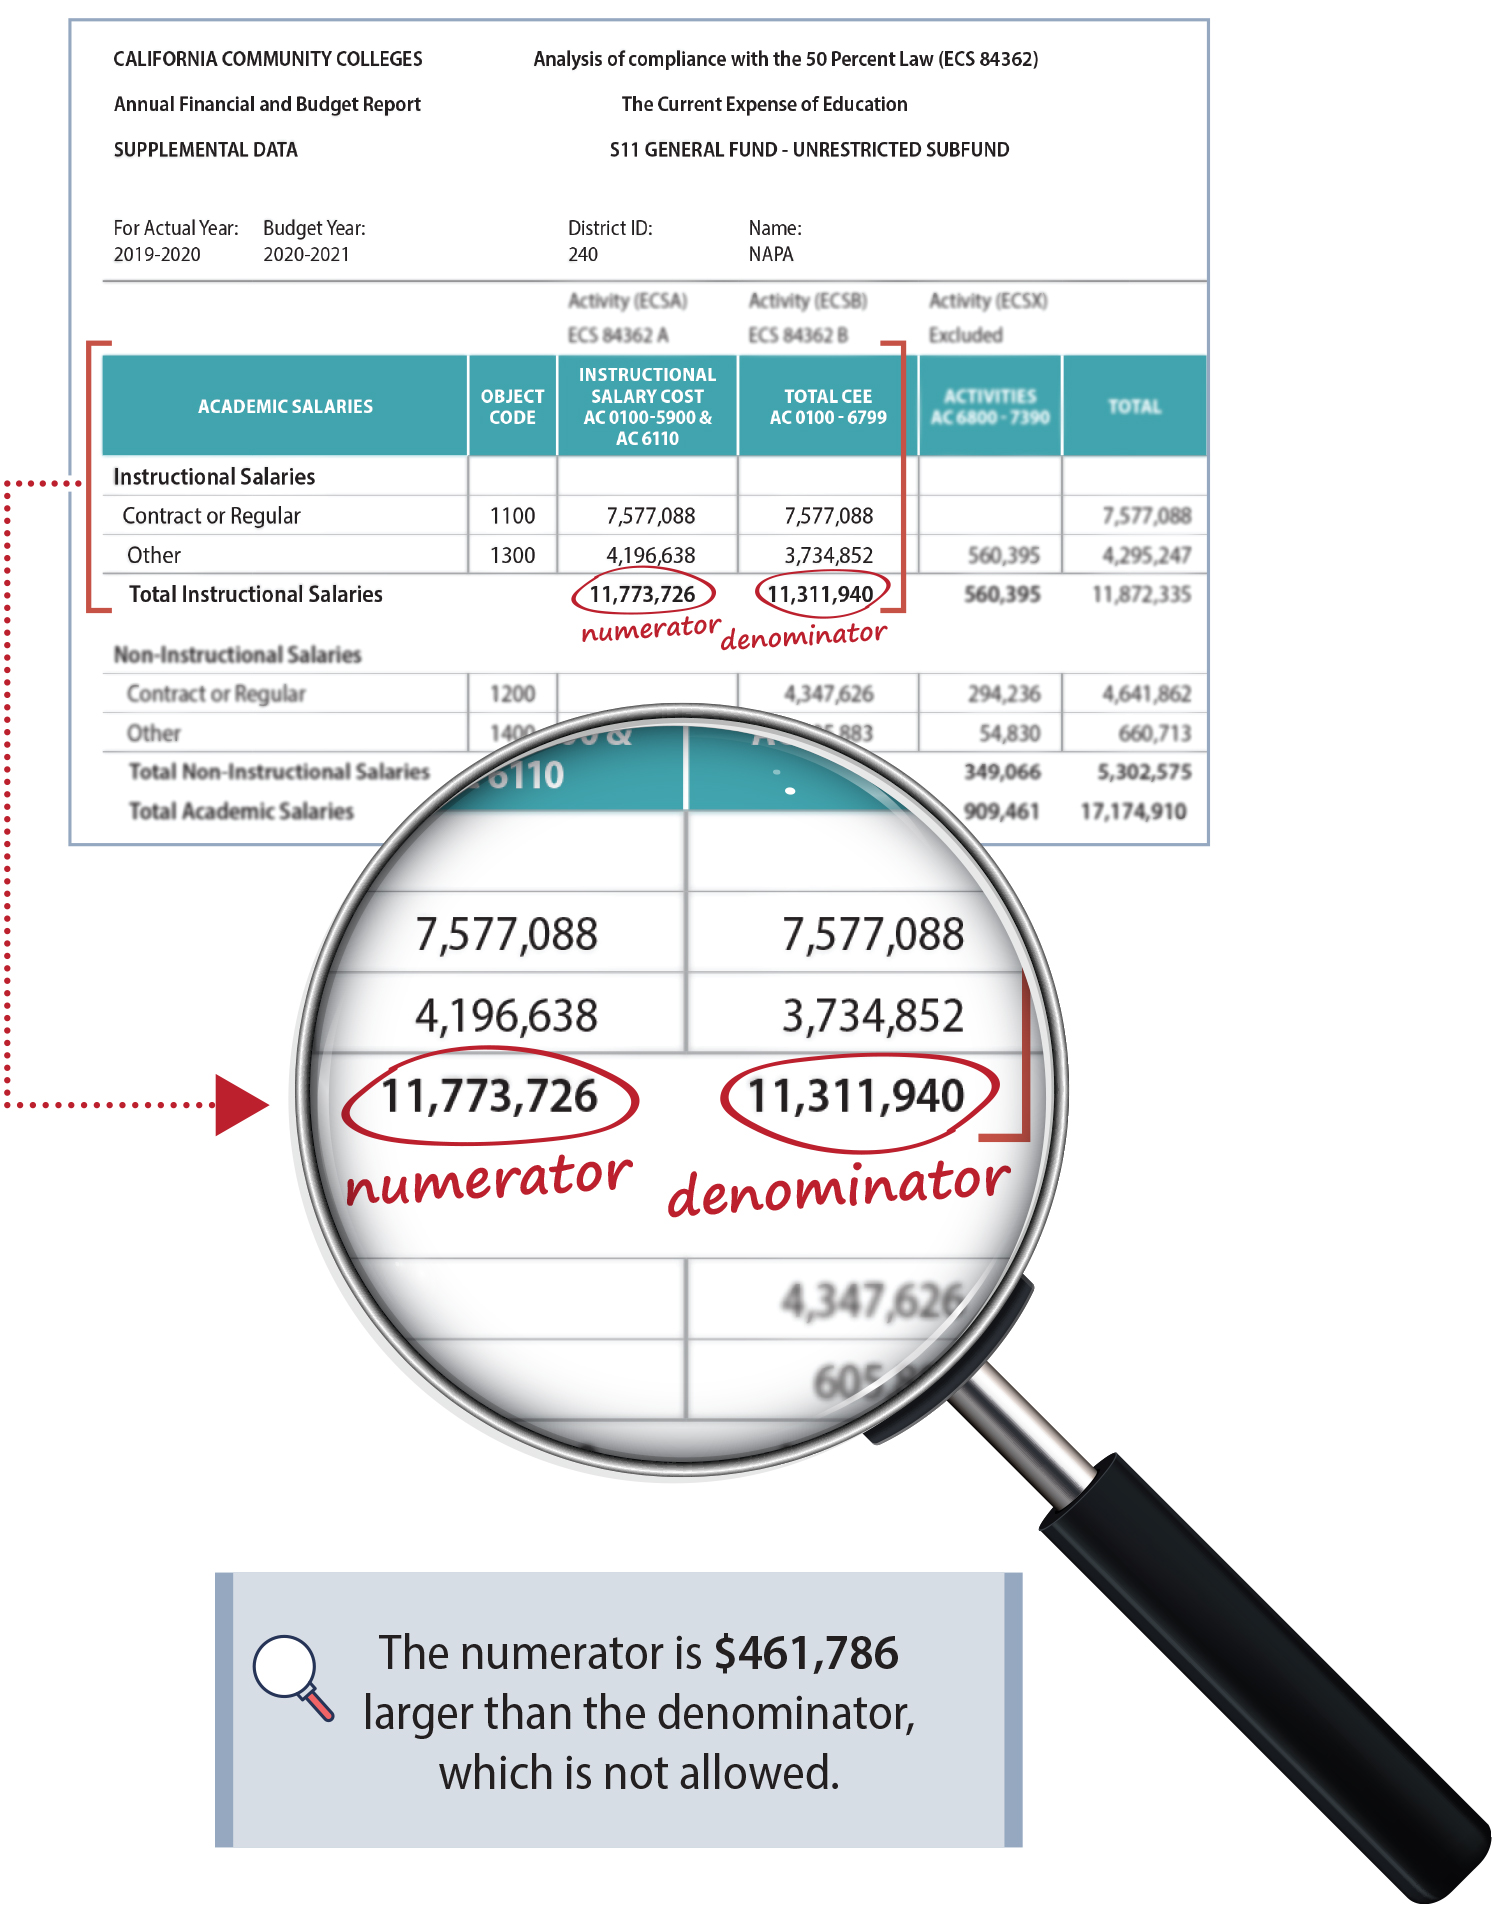
Four districts—MiraCosta, Napa, San Diego, and San Mateo—incorrectly reported a larger amount in certain categories for Instructor Salaries or the numerator, than in Current Educational Expenses, or the denominator, leading those districts to incorrectly overstate their compliance rates. The 50 Percent Law requires districts to also include in the Current Educational Expenses all transactions that are in Instructor Salaries. This means that a district cannot report a larger amount in Instructor Salaries than it reports in Current Educational Expenses. Doing so incorrectly leads to an overstated compliance rate. When we reviewed Napa’s financial reports, we saw that in fiscal year 2019–20 the district reported $461,786 in Instructor Salaries that it did not include in Current Educational Expenses, as Figure 6 shows. This error contributed to Napa becoming noncompliant with the 50 Percent Law in that fiscal year. Napa explained that the individual who submitted the report with this error no longer works for the district and the district was unable to locate documentation because of a cyberattack, all of which prevents it from identifying the cause of this error.
Figure 6
Napa Reported a Larger Amount in the Numerator of Its 50 Percent Formula Than It Did in the Denominator
Source: Napa’s fiscal year 2019–20 financial report.
This figure shows part of the financial and budget report submitted by Napa for fiscal year 2019-20. A magnifying glass calls attention to an error in Napa’s reporting where the district reported $11,773,726 in the numerator for instructional salaries and $11,311,940 in the denominator for instructional salaries. The numerator is $461,786 more than the denominator, which is not allowed.
Although we found that three other districts—MiraCosta, San Diego, and San Mateo—made similar errors, these errors were minor and did not affect the districts’ compliance with the law. San Diego explained that it believed that reporting transactions in Instructor Salaries but not in Current Educational Expenses was appropriate, although a fiscal specialist at the Chancellor’s Office indicated that this was not the proper way to report those transactions. Regardless, the Chancellor’s Office indicated that it does not verify the reported information on the districts’ financial reports because it relies on annual audits performed by CPAs. Had the Chancellor’s Office performed a simple review of the districts’ financial reports, it could have identified these errors just as we did.
The Law Is Unclear About the Use of Lottery Funds, Which Could Have Affected Two Districts’ Compliance Rates
Although improperly spending lottery funds is not a type of error we present in Figure 5, our review of a selection of transactions across the 10 districts caused us to question whether two districts properly spent proceeds from the California State Lottery Education Fund (lottery funds). Districts use various funding sources to pay for transactions during the course of a fiscal year. One such funding source that districts use is a quarterly allocation from lottery funds. State law prohibits the use of certain lottery funds for noninstructional purposes. However, two districts we reviewed, Redwoods and Mt. San Antonio, used lottery funds for utility payments and bank fees. We question whether these transactions are for an instructional purpose and therefore an allowable use of lottery funds.
The Chancellor’s Office categorizes lottery funds as a form of categorical aid or restricted funding, and districts must exclude categorical or restricted funds from their calculation when reporting their compliance with the 50 Percent Law. Because lottery funds are excluded from the 50 percent formula, the districts excluded these transactions from the 50 percent calculation. Had the districts instead used their unrestricted general fund to pay for these transactions, they would have included those transactions in Current Educational Expenses, or the denominator of the 50 percent formula, decreasing their compliance rate. Because the districts potentially used lottery funds for noninstructional purposes, this may have affected their compliance with the 50 Percent Law. However, Mt. San Antonio and Redwoods maintain that had they taken the approach of charging other support services instead of charging utilities to lottery funds, they still would have remained compliant.
The districts may have improperly spent lottery funds, in part, because of unclear guidance about what constitutes an expenditure for a noninstructional purpose. Specifically, until September 2024 when we pointed out to the Chancellor’s Office that state law prohibits the use of lottery funds for noninstructional purposes, the Chancellor’s Office’s website had improperly directed districts to use lottery funds to pay for noninstructional expenses, such as on energy and insurance. Further, in 2021 the Chancellor’s Office participated in a presentation at a conference for ACBO that stated this same incorrect guidance. Following our questioning of its website’s guidance, the Chancellor’s Office agreed that its guidance conflicted with state law and amended its website to remove this guidance. Nevertheless, Mt. San Antonio district maintains that using lottery funds to pay for utilities is appropriate. From the district’s perspective, utilities are used for instructional purposes, given that they ensure that instructional space, including classrooms and labs, are functional and suitable for the education of students. Mt. San Antonio noted, however, that it did not have an internal or external legal opinion on this topic. When we asked the Chancellor’s Office whether it agreed that using lottery funds to pay for utilities is using the funds for an instructional purpose, its general counsel stated that it had not issued a legal opinion on the matter and that districts have discretion on how they choose to use lottery funds as long as those uses are consistent with state law.
To gain further clarification about the appropriate use of lottery funds, we asked a representative from the California Department of Education (CDE), which also provides guidance on the use of lottery funds, whether the department would consider a district’s use of lottery funds to pay for utilities to be a noninstructional or instructional purpose. Similarly, CDE indicated that it does not provide advice on specific expenditures of lottery funds and that the use of lottery funds is solely at the discretion of the districts within state law parameters. Our office was unable to identify any definitions in state law for what constitutes an expenditure for instructional or noninstructional purposes in relation to districts’ use of lottery funds. The Chancellor’s Office’s lack of direction on whether spending lottery funds on utilities is for an instructional or noninstructional purpose, in combination with its former incorrect guidance, indicates that it needs to examine and issue additional direction about this matter in relation to the 50 percent calculation.
The Chancellor’s Office Must Improve the Training and Guidance It Provides to Districts Regarding Compliance With the 50 Percent Law
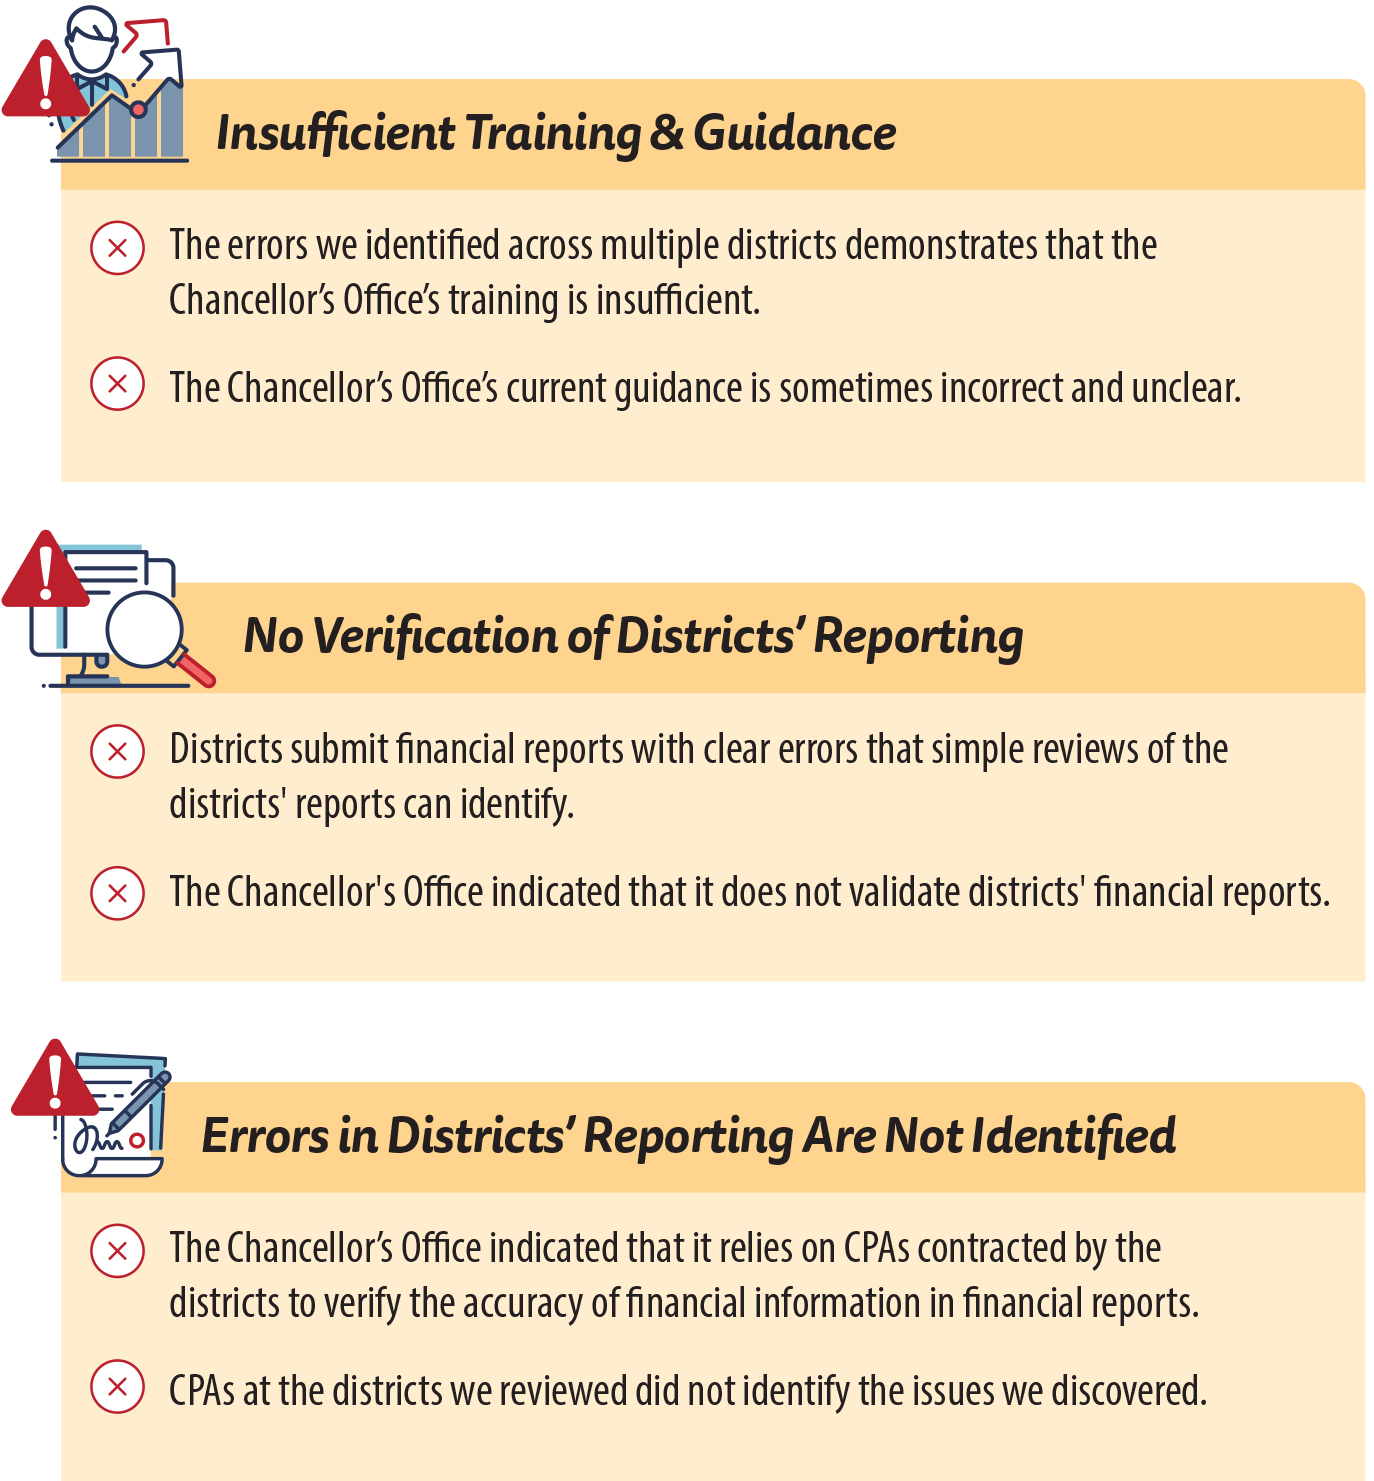
Because of the errors we identified in the districts’ reporting, we reviewed and assessed the training and guidance that the Chancellor’s Office provides to districts and interviewed Chancellor’s Office staff about its training and guidance. We found that the Chancellor’s Office’s training and guidance is insufficient and should be improved. Additionally, it does not perform its own review of districts’ financial reporting and the annual audits performed by CPAs that the Chancellor’s Office relies on did not catch the errors we identified. Figure 7 shows the results of our review.
Figure 7
Errors in District Reporting Can Be Attributed, in Part, to the Chancellor’s Office’s Limited Oversight of Districts’ Compliance With the 50 Percent Law
Source: Chancellor’s Office documents and auditor analysis.
This figure shows three boxes that illustrate the limited oversight provided by the Chancellor’s Office. From the top, the first box shows that the Chancellor’s Office’s training and guidance is insufficient. This box states the errors we identified across multiple districts demonstrates that the Chancellor’s Office training is insufficient and it further states that the Chancellor’s Office’s current guidance is inconsistent and unclear. The second box shows that the Chancellor’s Office performs no verification of districts’ reporting. It states that districts submit financial reports with clear errors that simple reviews of the districts’ reports can identify, and that the Chancellor’s Office indicated that it does not validate districts’ financial reports. The third box shows that errors in district reporting are not identified. It states that the Chancellor’s Office indicated that it relies on CPAs contracted by the districts to verify the accuracy of financial information in financial reports and that the CPAs at the districts we reviewed did not identify the issues we discovered.
A fiscal specialist at the Chancellor’s Office explained that it does not offer scheduled trainings to districts about reporting their compliance with the 50 Percent Law unless districts specifically request assistance. The fiscal specialist stated that instead ACBO provides trainings to district administration and CPAs at the twice‑annual ACBO conferences in which the 50 Percent Law is a frequent topic for workshops. The fiscal specialist further explained that the districts are responsible for interpreting and applying the law according to their own unique financial circumstances and that there is no one‑size‑fits‑all approach. She said that the Chancellor’s Office remains available to provide technical support upon request, ensuring that districts have the necessary support while upholding the principle of local governance and decision‑making. However, we disagree with this approach and believe it is insufficient when we consider the quantity and frequency of errors we identified. Furthermore, the lack of training is compounded by the sometimes unclear or incorrect guidance the Chancellor’s Office provides. As a result, the Chancellor’s Office should provide regular trainings to districts on reporting for the 50 Percent Law and should clarify its guidance to be clearer.
Further, we believe that the Chancellor’s Office should also perform its own review of the districts’ reporting of compliance with the 50 Percent Law, and it should update its guidance for the CPAs. The vice chancellor of college finance and facilities planning at the Chancellor’s Office explained that it does not have the capacity to audit and verify the information districts report in their financial reports. Each year, districts have all of their financial statements audited by CPAs. The CPAs then publish reports detailing the opinions of these audited financials. As a part of these audit reports, the CPAs publish opinions on districts’ compliance with various state laws, including the 50 Percent Law. We reviewed the 50 Percent Law portion of the audited financial reports CPAs published for the 10 selected districts for fiscal years 2018–19 through 2022–23, and found that the CPAs did not identify the errors we identified.
The Chancellor’s Office’s Contracted District Audit Manual (audit manual) includes suggested audit procedures for the CPAs to perform related to the districts’ reporting of compliance with the 50 Percent Law. We spoke with two CPA firms—one of whom noted that it is an auditor of more than a third of the districts in the State—who explained that they perform all the suggested audit procedures. However, because the CPA firms did not identify the errors that we did in our review, it is clear that more needs to be done to ensure accurate reporting. The Chancellor’s Office should review and update its guidance in the audit manual where necessary for the CPAs to ensure that CPAs identify these errors. The Chancellor’s Office should also conduct its own review of the districts’ financial reports, such as reviewing the forms submitted by the districts to identify clear errors of misreporting and flag potential areas for concern.
We identified some of these same problems in an audit on this subject that our office issued 25 years ago. In our October 2000 report, California Community Colleges: Poor Oversight by the Chancellor’s Office Allows Districts to Incorrectly Report Their Level of Spending on Instructor Salaries, Report 2000‑103, we found that districts made errors in calculating their compliance with the 50 Percent Law. These errors included increasing the Instructor Salaries by including costs for noninstructional assignments and reducing the Current Educational Expenses by excluding activities that should have been included. In our October 2000 audit, we made eight recommendations to the Chancellor’s Office to address these errors. However, at the time of our current audit, the Chancellor’s Office had only fully implemented one recommendation from that audit: we had recommended that the Chancellor’s Office expand suggested audit procedures for district CPAs to detect errors in risky areas, such as instructor reassignments and exclusions from Current Educational Expenses, which it has done. When we asked the Chancellor’s Office about why it had fully implemented only one of our eight recommendations, a fiscal specialist at the Chancellor’s Office could not provide an explanation because historical records from the time of our October 2000 audit are not readily available. Nevertheless, the errors we identified in our previous report persist today, and the Chancellor’s Office must address them to ensure that districts accurately report their compliance with the 50 Percent Law.
The Chancellor’s Office Has Not Followed Its Exemption Process and Lacks an Effective Mechanism for Holding Noncompliant Districts Accountable
During the last decade, the Chancellor’s Office has not required noncompliant districts to follow the process for filing an exemption request or a plan for achieving compliance (compliance plan). Five of the 73 districts reported they were noncompliant at least once from fiscal years 2018–19 through 2022–23, and four of those districts did not follow the exemption process. State law authorizes a district that does not comply with the 50 Percent Law to apply to the Chancellor’s Office for an exemption. Districts applying for an exemption must meet criteria established in state law, as we describe in the text box. If a noncompliant district does not receive an exemption from the CCC Board of Governors, state law requires that it submit a compliance plan detailing how it will spend the deficient amount for Instructor Salaries during the next fiscal year. The deficient amount is the nonexempt amount by which the district fell short on spending on Instructor Salaries to comply with the 50 Percent Law. Districts that fail to comply with the 50 Percent Law risk losing part of their state apportionment equivalent to the deficient amount. Despite these requirements, according to a fiscal specialist from the Chancellor’s Office, the Chancellor’s Office has not withheld any district’s apportionment during the last decade because of noncompliance with the 50 Percent Law.
Exemptions From the 50 Percent Law Require the District to Demonstrate Serious Hardship or That Compliance Would Result in the Payment of Classroom Instructor Salaries in Excess of Those Paid by Comparable Districts
Serious hardship are conditions under which:
- Complying with the 50 Percent Law would have prevented the district from discharging financial liabilities.
- The first year of new funding resulted in the district’s inability to meet the requirements of the 50 Percent Law.
- Unanticipated, unbudgeted, and necessary spending prevented compliance with the 50 Percent Law.
- The district has expended funds with the agreement of the district’s academic employee representative or, if none exists, the academic senate, and the district can document the necessity of, and adverse impact of not spending, the funds.
A district will be considered to have paid salaries in excess of those paid by comparable districts when, among other requirements, its spending on salaries of classroom instructors exceeds those of other districts of comparable type and functioning under comparable conditions.
Source: State law.
We identified five of the 73 districts that were responsible for a total of 16 instances in which a district reported noncompliance with the 50 Percent Law from fiscal years 2018–19 through 2022–23. State law requires a noncompliant district seeking an exemption to file an initial exemption application by September 15 following the year of noncompliance. The initial exemption application serves as a notification to the Chancellor’s Office that the district may not meet compliance with the 50 Percent Law and marks the beginning of a two‑step process.
According to the Chancellor’s Office, the first step of the exemption process entails the Chancellor’s Office offering guidance to the district aimed at improving various aspects of the district’s accounting practices, such as expense allocation, accounting code usage, and fund optimization, to help bring the district into compliance with the 50 Percent Law. If, after these efforts, a district determines that it is still noncompliant, the second step is for the district to proceed with the exemption process by submitting to the Chancellor’s Office a second exemption form along with additional supporting information. The additional supporting information must explain how the district’s exemption request meets the applicable requirements, such as by indicating how certain costs qualify as “serious hardship” and by certifying that the district has provided a copy of the application to the exclusive representative of the district’s academic employees and the district or college academic senate. The CCC Board of Governors is responsible for approving exemption requests.5 Only one district, Contra Costa, followed the entire exemption process in fiscal year 2021–22, including submitting the exemption forms and additional supporting information, and it ultimately received an exemption for serious hardship.
Another district, Calbright, was responsible for four of the 16 instances, but the Chancellor’s Office did not require that it follow the exemption process. In 2018, the State created the California Online Community College District, later named Calbright College, to provide working adults access to high‑quality, affordable, and flexible opportunities to pursue postsecondary education. From fiscal years 2019–20 through 2022–23, Calbright’s reported compliance rate ranged from zero to nearly 6 percent, and the district’s annual audits found it to be out of compliance, noting that it did not apply for an exemption in those years as state law requires. In 2022, the Chancellor’s Office issued a letter granting Calbright an exemption from complying with the 50 Percent Law, citing the college’s lack of accreditation and its ongoing development of educational programs and its hiring of instructional faculty. As the Chancellor’s Office’s general counsel explained to us, Calbright received the exemption because it was in its start‑up phase and did not receive state apportionment. In the exemption letter, the Chancellor’s Office also explained that it would allow the district to deviate from the exemption process established in law by not requiring Calbright to submit the second exemption application. When we asked for the legal basis allowing the Chancellor’s Office to exempt Calbright from having to submit the second exemption application, the Chancellor’s Office’s general counsel did not provide one but informed us that going forward it will require Calbright to follow the two‑step exemption process prescribed in law.
The Chancellor’s Office did not require noncompliant districts to submit compliance plans with the requisite information. In the remaining 11 of the 16 instances in which districts did not comply with the 50 Percent Law, the three noncompliant districts did not file for an exemption and were therefore required to submit compliance plans in accordance with state law. In all 11 instances, the districts were community‑supported districts: Marin, Napa, and San Mateo. San Mateo is responsible for five instances, as Figure 8 shows. However, in each instance these districts either did not file a plan, or filed plans that did not detail how those districts intend to spend the deficient amount in the next fiscal year to become compliant. Although the Chancellor’s Office’s letter to districts requesting compliance plans directs the districts to include any details on any plans and activities that the district has in place to resolve the deficiency, the Chancellor’s Office does not instruct the districts to develop a plan as to how the deficient amount will be expended for salaries of classroom instructors during the next fiscal year, as required by state law. As a result, the Chancellor’s Office continues to accept insufficient plans that do not commit to correcting any deficiency.
Figure 8
Most Districts That Were Noncompliant With the 50 Percent Law Did Not Follow the Exemption Process in State Law
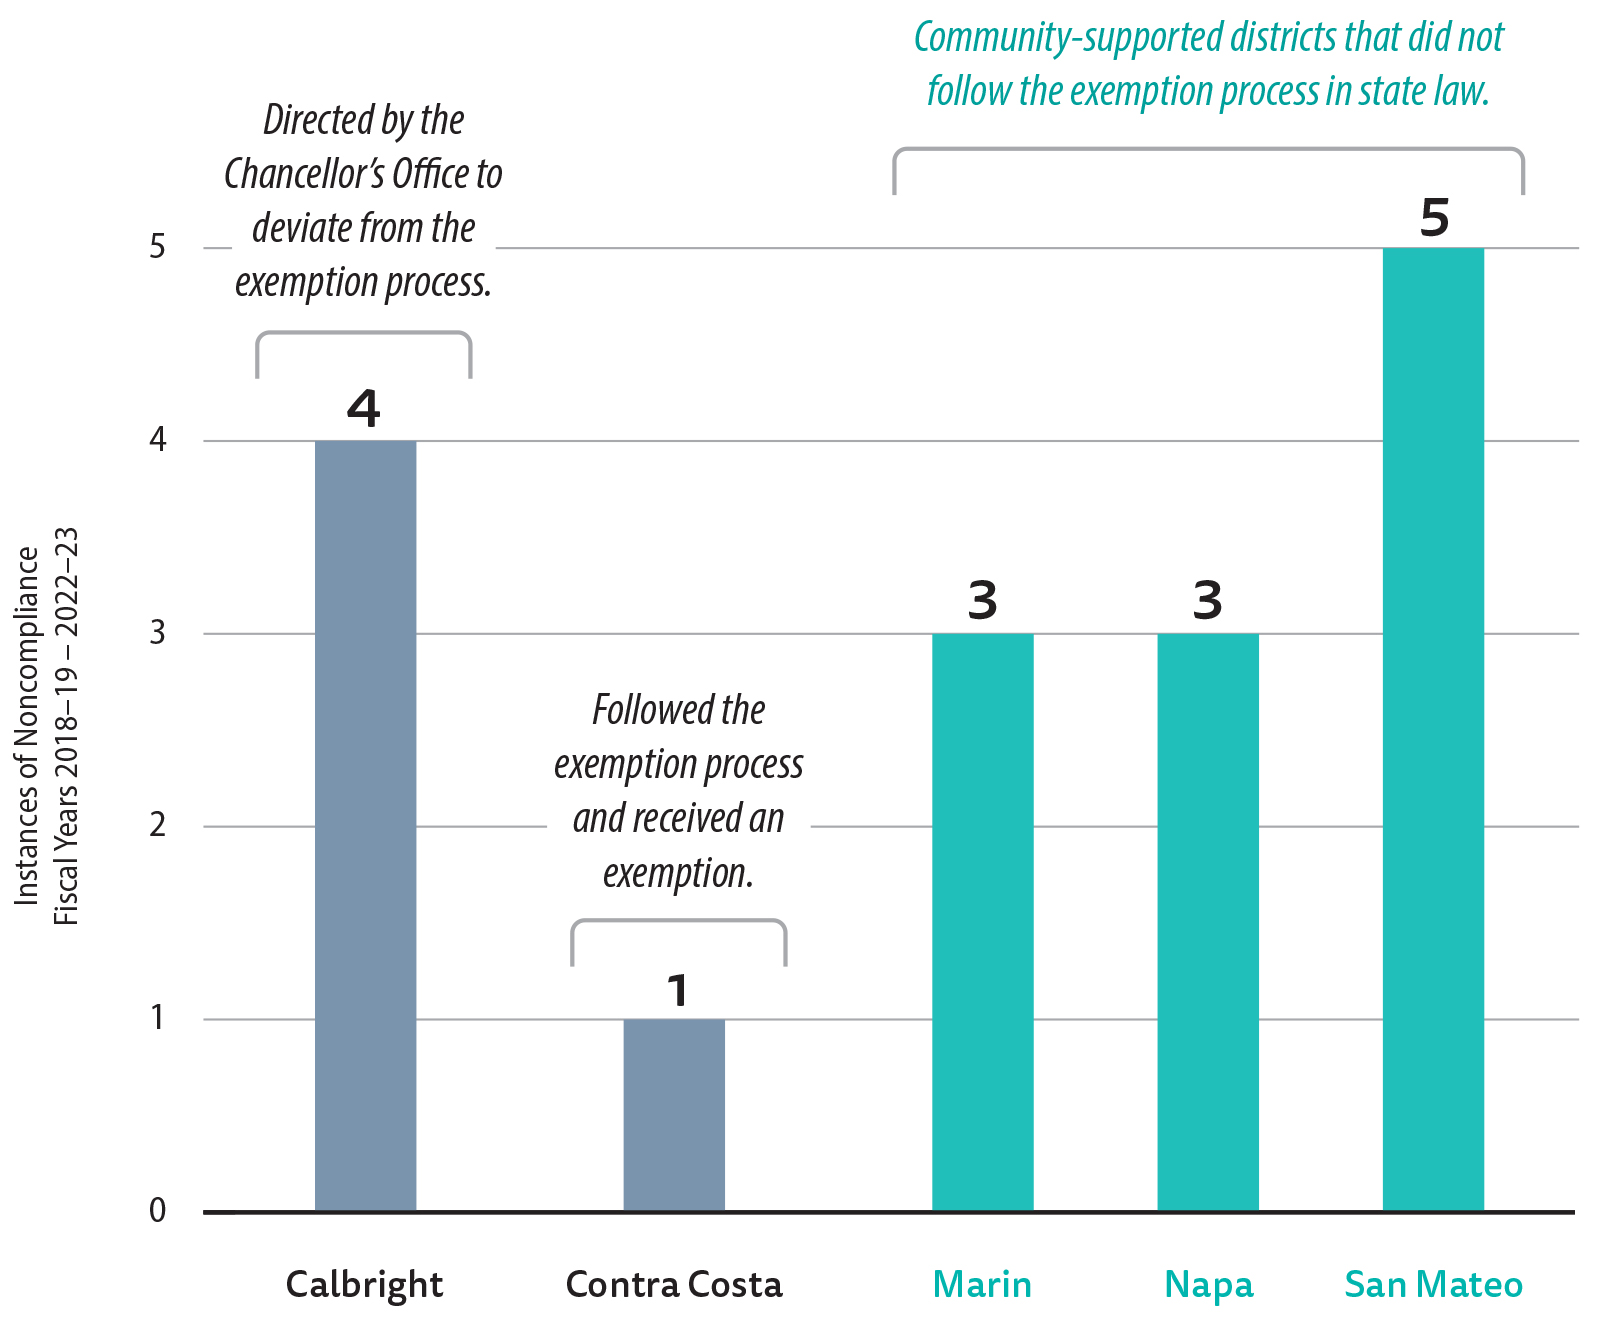
Source: Chancellor’s Office exemption documentation, interviews with Chancellor’s Office staff, and other documents.
This figure is a bar graph that shows the five districts which reported noncompliance with the 50 Percent Law, and the number of years each district reported noncompliance from fiscal years 2018-19 through 2022-23. The figure also provided context as to which districts followed the exemption process in state law for noncompliant districts. From the left, the figure shows that Calbright reported noncompliance in four years and were directed by the Chancellor’s Office to deviate from the exemption process. Next, the figure shows Contra Costa was responsible for the one instance in which it followed the exemption process and received an exemption. Next, the figure shows Marin and Napa reported noncompliance in three years and San Mateo reported noncompliance in five years and that those three districts are community-supported districts that did not follow the exemption process.
The Chancellor’s Office could not provide documentation indicating that it had obtained certification of the plan from the district’s governing board, a requirement for the plans in state law. State law requires that the governing board of the district certify compliance plans and that those plans include expenditures for Instructor Salaries over and above the amount regularly budgeted for the year. A fiscal specialist from the Chancellor’s Office explained that the Chancellor’s Office does not currently verify whether the districts’ boards of governors or governing boards have approved the compliance plans. The Chancellor’s Office explained that it operates on the assumption that districts will adhere to their own internal governance and approval protocols before submitting the plans. However, she agreed that the law does mandate that districts present their plans to their governing boards for certification and indicated that the Chancellor’s Office is considering measures to verify this in the future.
If a district does not become compliant within two years, state law requires an amount equal to the deficient amount to be deducted from apportionments that the district receives from the State. According to the Chancellor’s Office, this enforcement mechanism applies only to a district’s state apportionments and not to categorical funding, which the Chancellor’s Office defines as funds for which the State has indicated a specific purpose, such as student housing or disabled student programs. Therefore, even though community‑supported districts make up the majority of districts that are noncompliant, withholding of state apportionments as a means for enforcing the 50 Percent Law would not affect community‑supported districts because they do not receive state apportionments. This same principle would apply to Calbright for the same reason, even though it is not a community‑supported district. Nevertheless, state law requires all districts—including community‑supported districts—to comply with the 50 Percent Law. Without a change to the 50 Percent Law, the Chancellor’s Office will continue to lack a mechanism to enforce the 50 Percent Law for community‑supported districts.
Available Data Indicate That Districts’ Investment in Administrators Has Increased at a Greater Rate Than Their Investment in Faculty
Key Points
- Although state law requires, and the Chancellor’s Office implements, a statewide educational and fiscal accountability system that provides performance data on students, programs, and institutions, we identified concerns with the salary and staffing data that made us question whether the Chancellor’s Office and other stakeholders can rely on the data.
- Available data show that districts’ investment in administrators has outpaced investment in faculty and support staff. Although districts have discretion to create new administrator positions, districts documented inconsistent justifications for creating those positions.
We Identified Anomalies and Discrepancies in the Statewide Staffing and Salary Data We Reviewed
To identify changes in districts’ staffing, compensation, and operating budgets for administrative positions, we obtained full‑time equivalent (FTE) staffing data and total salary data for administrators, faculty, and support staff from the Chancellor’s Office. The Chancellor’s Office provided us with data in the three categories we detail in the text box based on information that districts submit to it. In proposing the 50 Percent Law, the Senate fact‑finding committee report intended to address the costs of employing personnel outside the classroom relative to inside the classroom. For this audit, we refer to executive, administrative, and managerial personnel as administrators. In our review of the Chancellor’s Office’s statewide FTE staffing and salary data and of data from the 10 districts we reviewed, we identified anomalies and discrepancies that made us question its accuracy and reliability.
Chancellor’s Office Employment Categories
Administrators: Includes executive, administrative, and managerial persons such as presidents, vice presidents, deans, assistant deans, associate deans, and any other administrators whose assignments require primary responsibility for management of the institution or department, and development of management policies or general business operations.
Faculty: Includes faculty who hold academic-rank titles such as counselor, librarian, professor, associate professor, lecturer, healthcare, learning disabilities, and others.
Support: Includes clerical, technical—such as engineering aides, instructional aides, lab assistants, and athletic program assistants—skilled crafts like electricians and carpenters, service and maintenance staff, instruction and research assistants, and other non-faculty positions.
Source: Chancellor’s Office Management Information System data element dictionary.
State law requires, and the Chancellor’s Office implements, a statewide educational and fiscal accountability system that provides data on students, programs, and institutions. The system the Chancellor’s Office implemented is its Management Information System (MIS). State law intends for this accountability system to help identify the educational and fiscal strengths and weaknesses of the CCC and to improve the quality of education. As a condition for receiving certain funds in the annual Budget Act, each district must submit data annually to the Chancellor’s Office. The Chancellor’s Office publishes much of this data on its website. Because of the anomalies and discrepancies we identified in districts’ reporting of FTE staffing and salary data, stakeholders in the CCC may not be able to rely on data to help accomplish the intended purpose of this accountability system.
Our analysis of data across all 73 districts identified more than 40 anomalies in nine districts for FTE staffing data and more than 45 anomalies in five districts for salary data from fiscal years 2012–13 through 2023–24.6 Data anomalies are irregularities that could indicate errors or omissions in the data. For example, Victor Valley did not report any FTE for administrators, faculty, or support staff in fiscal years 2021–22 and 2022–23, and Feather River did not report any FTE for administrators, faculty or support staff for fiscal year 2015–16. Similarly, two districts—Citrus and Feather River—reported that they did not have any FTE for administrators in fiscal year 2022–23. In another example, Mt. San Jacinto reported less than one FTE for administrators and support staff from fiscal years 2020–21 through 2023–24, even though it reported 55.23 FTE for administrators and 322.71 FTE for support staff in fiscal year 2019–20. Because Mt. San Jacinto’s enrollment increased slightly from about 11,835.06 total student FTE in fiscal year 2019–20 to 12,043.92 total student FTE in fiscal year 2022–23, we question whether the district’s reported data of less than one FTE for administrators during these years were valid. We also identified potential errors in the salary data reported to the Chancellor’s Office. Five districts—Barstow, Cabrillo, Shasta‑Tehama‑Trinity, Southwestern, and Victor Valley—reported $0 salary totals in certain years. For example, Barstow reported no salary data for any of the staff categories in fiscal years 2017–18 and 2018–19. These anomalies made us question whether districts may have misreported the data or not reported data at all. Because we did not audit these districts, we did not follow up about these anomalies.
Of the 10 districts we reviewed, we found multiple discrepancies in the data from three districts—MiraCosta, Napa, and Redwoods—when comparing the aggregate salary data that districts provided to the Chancellor’s Office to the salary data that the districts provided to us. Data discrepancies occur when the same data provided by two different entities does not match. For example, officials at Napa could not provide the original data that it submitted to the Chancellor’s Office because the person who processed and submitted the data for many years had retired. To validate its data submissions, we compared the data files Napa provided to us with those that the district provided to the Chancellor’s Office. Although we expected these files to match, we found that the total faculty salary data differed by 39.90 percent to 74.34 percent from fiscal years 2013–14 through 2023–24 and that the support staff total salary data differed by 4.68 percent to 25.01 percent during the same period. Similarly, we identified discrepancies in Redwoods’ total salary data for faculty. From fiscal years 2020–21 through 2023–24, the total faculty salary data that Redwoods provided to us differed from the Chancellor’s Office’s data by 7.92 percent to 31.22 percent, respectively. MiraCosta officials acknowledged that it had discrepancies in its salary data because of a system error, resulting in discrepancies as large as 62.08 percent for total faculty salaries from fiscal years 2016–17 through 2023–24, the only years that the data were readily available.
Although we found that the data San Mateo provided matched the Chancellor’s Office data, San Mateo asserted that the data the Chancellor’s Office provided to us did not accurately reflect the district’s administrator FTE numbers. To demonstrate this, San Mateo provided us with data from its payroll system.7 These district‑provided data showed that the district’s administrator FTEs increased by 17 percent during the period we reviewed—the number of administrator FTEs grew from 48 in fiscal year 2013–14 to 56 in fiscal year 2023–24. The data the Chancellor’s Office provided showed an increase of 45 percent, with the number of administrator FTEs growing from 38 in fiscal year 2013–14 to 55 in fiscal year 2023–24.
These anomalies and discrepancies call into question whether the Chancellor’s Office and other stakeholders can rely on the data. The vice chancellor of workforce and research in the Chancellor’s Office agreed that creating additional checks, such as notifying districts that submit fewer than one FTE or less than one dollar for salaries, may help identify inaccurate reporting. Further, he said that additional training and guidance for their use of MIS may help prevent districts from making errors in the future. He indicated that the Chancellor’s Office is in the nascent stages of implementing training and additional guidance for submitting data to MIS and did not have any planning documents to provide at the time of our audit.
Due to the anomalies we identified in the statewide FTE staffing and salary data and the discrepancies we identified at some of the districts, we question the precision of these data. Further, because it is the most readily available source of the aggregate data across 73 districts, we present the Chancellor’s Office’s data in the next section and in Appendix C.
Districts’ Investments in Administrators Has Generally Outpaced Investments in Faculty and Support Staff
Although the Senate fact‑finding committee report that proposed the 50 Percent Law sought to direct more school funding toward teacher salaries rather than to personnel outside the classroom, the districts reported an increase in administrators and their salaries compared to FTEs and salaries of faculty and support staff, which calls into question how effectively the law has accomplished this goal. Several factors may account for this increase, such as the need to administer expanding grant programs. Further, some administrator positions may rely on restricted funding, which the 50 percent formula excludes and those salaries, therefore, do not affect a district’s compliance with the 50 Percent Law. Although districts have the discretion to create new positions, districts provided inconsistent information documenting the need for adding new administrators we reviewed. Regardless, districts reported improved student success across several metrics.
The Extent to Which Spending on Administrators Affects Districts’ Compliance With the 50 Percent Law Is Uncertain
As we discuss in the Introduction, by applying percentage guidelines for districts expending state funds for teachers’ salaries, the 50 Percent Law established a minimum percentage to be spent on teaching services relative to administrative services and other educational expenses. According to the report of the Senate fact‑finding committee, upon which the 50 Percent Law was based, the law in effect at the time tended to encourage the employment of personnel outside the classroom.
However, the statewide staffing and salary information we obtained from the Chancellor’s Office did not identify whether districts paid administrators from unrestricted funds or from restricted funds. If districts fund these administrator salaries with restricted funds, it is possible that districts could increase their spending on administrators without negatively affecting their compliance rate because the 50 percent formula excludes restricted funds. Thus, all of the staffing and salary information we present in this section includes all administrators, both those included and excluded from districts’ 50 percent compliance calculations.
Administrator FTEs and Salaries Have Increased at a Faster Rate Than Have Those for Faculty and Support Staff
According to the statewide FTE staffing data from the Chancellor’s Office, administrator positions have increased at a higher rate than those for faculty or support staff, as Figure 9 shows. Specifically, FTEs for administrators have increased by 45 percent from fiscal years 2013–14 through 2023–24, but faculty FTEs have only increased by only 3 percent during that same time period. We provide detailed information on FTEs by district in Appendix C.
Figure 9
Administrator FTEs and Salaries Significantly Increased From Fiscal Years 2013–14 to 2023–24 Compared to Student, Faculty, and Support Staff FTEs
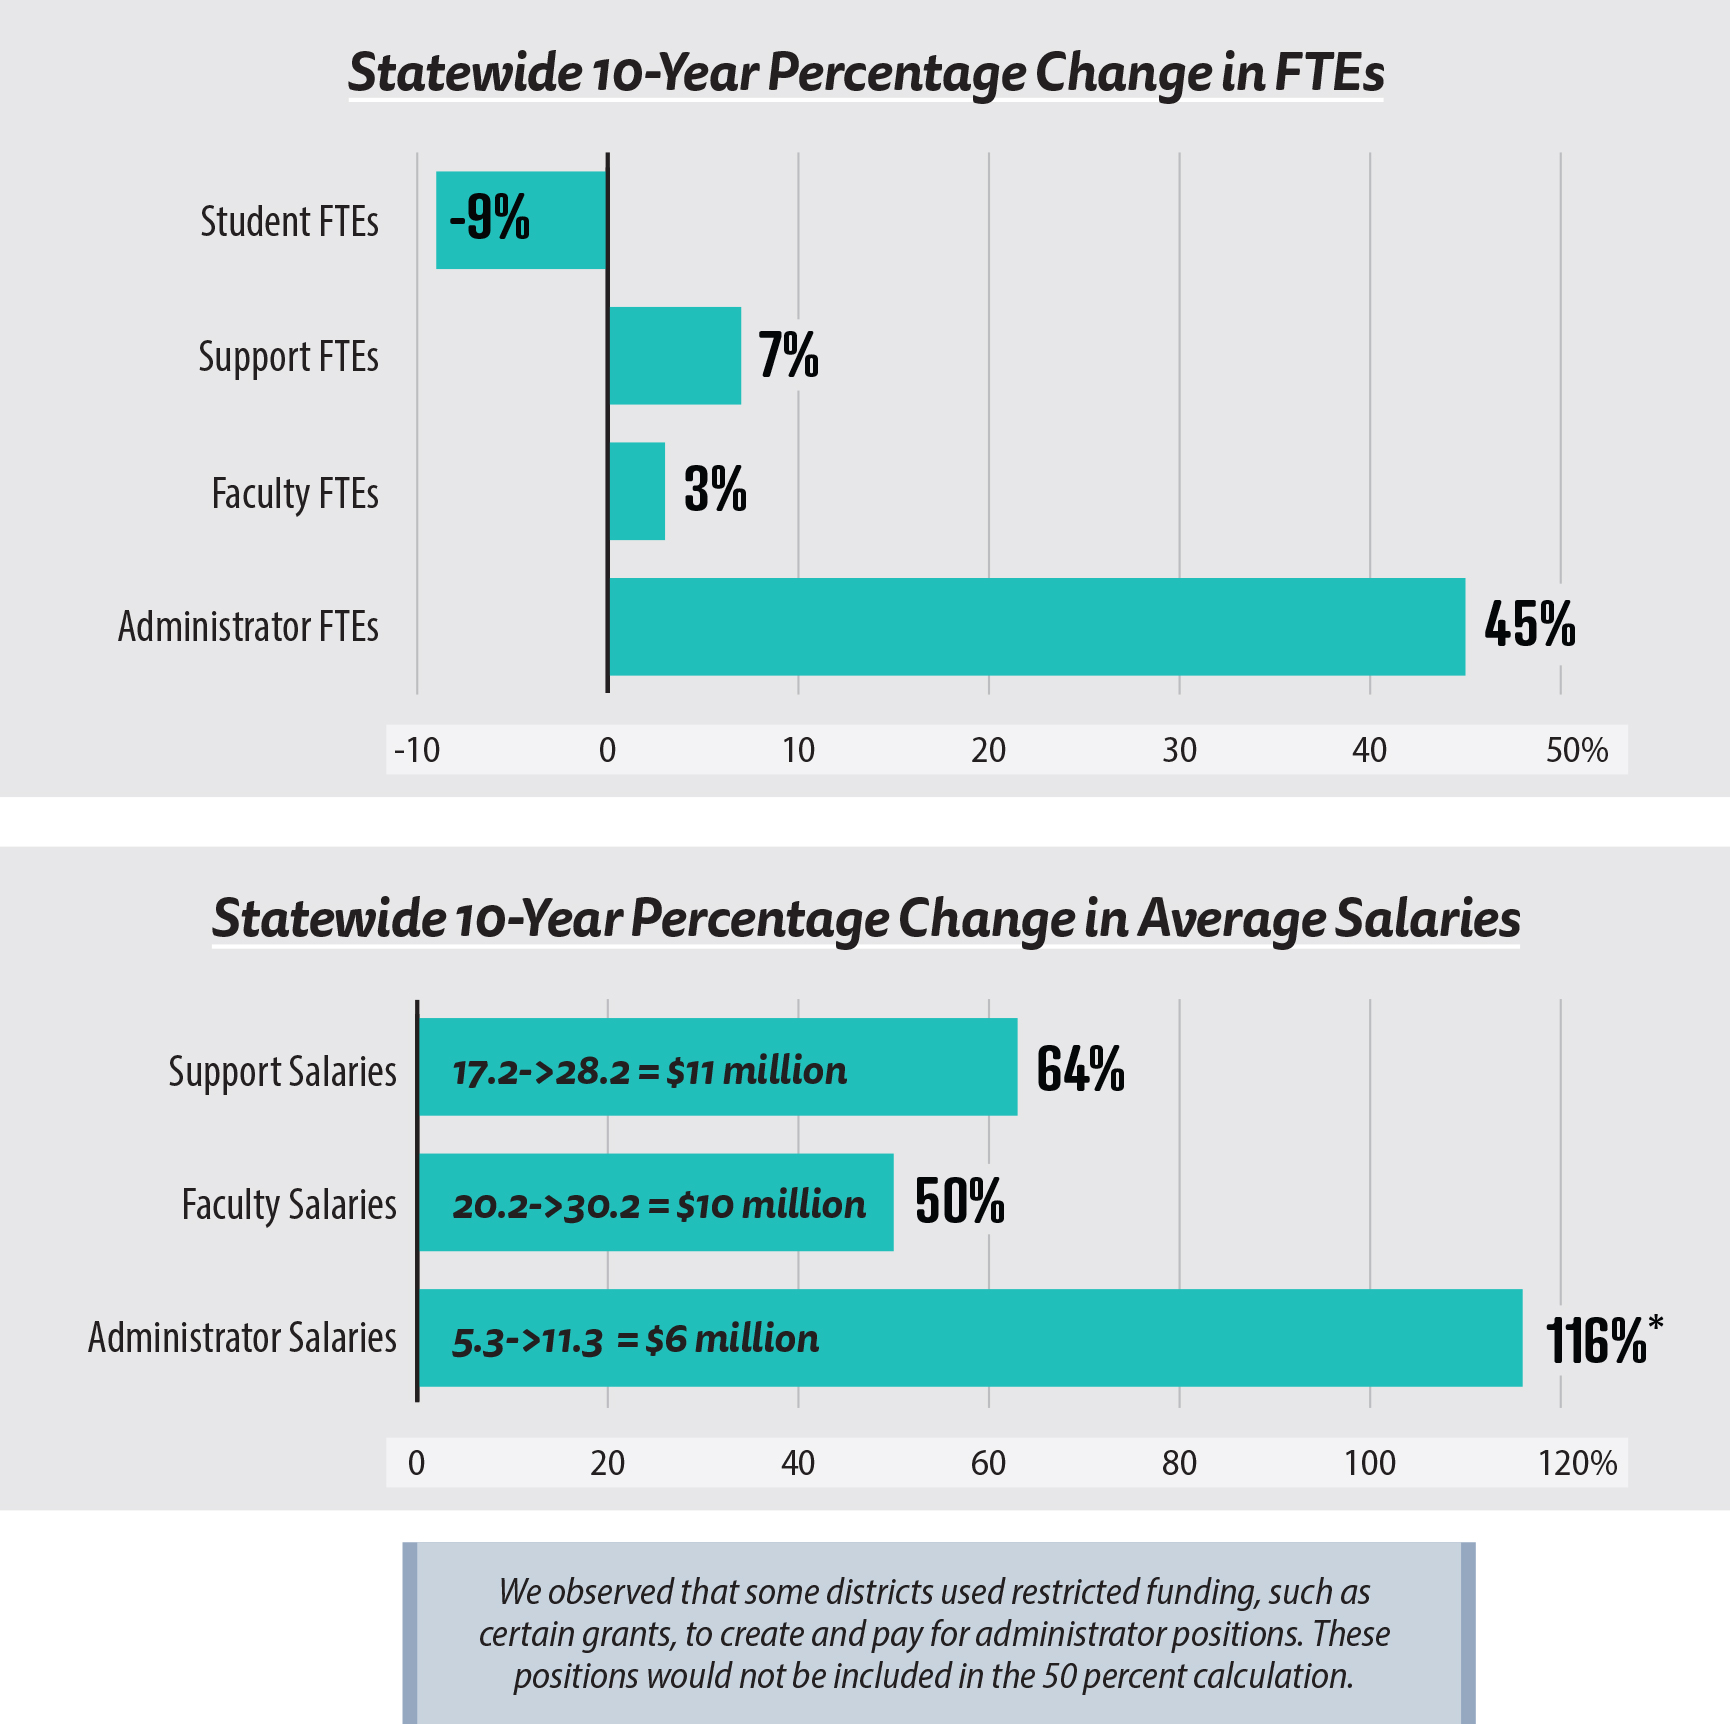
Source: Chancellor’s Office FTE and salary data, and district transaction documentation.
Note: We identified numerous anomalies and discrepancies in the statewide data that made us question its precision and reliability. However, because it is the most readily available data for all 73 districts, we present the numbers in this graphic.
* Percentage change may differ slightly due to rounding.
This figure depicts two horizontally orientated bar graphs. The top bar graph illustrates the percentage change in FTEs from fiscal years 2013-14 to 2023-24. It shows that student FTEs decreased by 9 percent, support FTEs grew by 7 percent, faculty FTEs grew by 3 percent, and administrator FTEs grew by 45 percent. The second bar graph illustrates the percentage change in average salaries over the same time period. It shows that support salaries grew 63 percent, faculty salaries grew 50 percent, and administrator salaries grew by 116 percent. Within each bar for the average salaries, the figure shows that the average support salaries grew from $17.2 to $28.2 million for the difference of $11 million. For faculty salaries, the average salaries statewide grew from $20.2 to $30.2 for a total increase of $10 million. For administrator salaries, average salaries statewide grew from $5.3 to $11.3 for an increase of $6 million. The figure also makes a note below the bar graphs stating that we observed that some districts used restricted funding, such as certain grants, to create and pay for administrator positions. These positions would not be included in the 50 percent calculation.
Like statewide trends, administrator FTE growth outpaced that of FTEs for faculty and support staff at most of the districts we reviewed, as Table 5 demonstrates. The districts gave various reasons for increasing the number of administrator positions. In general, most districts indicated that a contributing factor for the increase in administrator FTEs was the expansion of categorical or restricted funding programs, many of which require personnel to oversee and manage. MiraCosta, whose administrator FTEs grew by more than 85 percent from fiscal years 2013–14 through 2023–24, indicated that it created new positions, in part, to manage programs that the Legislature expanded, including programs such as Dual Enrollment and Guided Pathways.8 The district indicated that in fiscal years 2022–23 and 2023–24, it created other new administrator positions, including two grant‑funded positions whose funding was included in the grant proposals or were requirements of the grant. Similarly, other districts, such as Los Rios and Rio Hondo, reported the need for additional administrator positions, in part, to oversee new or expanding grant programs. Los Rios saw an increase in administrator FTEs of more than 30 percent, and Rio Hondo’s administrator FTEs increased by more than 65 percent from fiscal years 2013–14 through 2023–24. Mt. San Antonio explained that the primary factors contributing to the increase in new administrator positions were expanding student support services and implementing new grant‑funded or restricted‑funded programs. Mt. San Antonio saw an increase of more than 38 percent in administrator FTEs during the same period.
Although outpaced by increases in administrator FTEs, statewide faculty and support staff FTE data nonetheless show slight increases from fiscal years 2013–14 through 2023–24, as Figure 9 shows. Some districts reported that several factors may have contributed to the smaller increases in faculty FTEs, two of which include decreased student enrollment exacerbated by the pandemic and fewer classes offered because of changes to state laws enacted in 2017 and 2022, respectively. These changes generally required that community colleges maximize the probability that students will enter and complete transfer‑level or college‑level courses in English and mathematics within a one‑year time frame, and the laws generally prohibit colleges from requiring students to enroll in pre‑transfer‑level classes in English and mathematics under certain conditions.
Some districts asserted that these changes resulted in a reduced number of remedial classes that community colleges offer and that this reduction in classes subsequently led to a reduction in faculty positions. Some districts indicated that the Faculty Obligation Number (FON) may also drive faculty staffing levels. The FON generally requires districts to adjust the number of full‑time faculty in proportion to changes in student enrollment. Therefore, declining student enrollment rates, which we saw statewide from fiscal years 2013–14 through 2023–24, may have contributed to a district’s decision to increase full‑time faculty positions at smaller rates. Additionally, statewide support staff FTE data showed an increase of 7 percent from fiscal years 2013–14 through 2023–24. Some districts indicated that increased staffing was for new support programs that respond to the changing needs of students.
Additionally, the statewide salary data indicate that administrator salary growth has also outpaced that of faculty and support staff, as Figure 9 shows, which is similar to the FTE staffing trends. Specifically, from fiscal years 2013–14 through 2023–24, average total administrator salaries have increased by 116 percent, and average total faculty and support staff salaries have increased by 50 and 63 percent, respectively. Although administrator salaries grew at a higher rate than salaries for support staff or faculty, the average total amount districts spent on administrator salaries increased by $6 million, and the average total salaries for support staff and faculty increased by more than $10 million each. In fiscal year 2023–24, the average total amount spent on faculty salaries was nearly three times larger—$30.2 million—than that spent on administrator salaries—$11.3 million—likely because there are far more faculty than administrators.
The districts provided different reasons for the increases in administrator salaries. Rio Hondo district officials explained that the district performs regular salary studies for administrator positions to ensure that they are competitive and that it has also had cost‑of‑living adjustment increases. San Diego explained that the district has split up previously consolidated administrator positions, created new administrator positions, and revised its administrator salary schedules, which has caused the FTEs and total salaries to increase. Los Rios officials explained that because administrator positions are the hardest positions to fill and retain, the district tries to offer competitive salaries for those positions. The district further stated that it puts more compensation into the salaries and less into the benefits for administrator positions, but faculty compensation tends to include more compensation in the benefits side. Nevertheless, we could attribute the increase in average total salaries to districts’ adding additional positions and to increasing compensation. We provide detailed information on total salaries by each of the 73 districts for administrator, faculty, and support staff in Appendix C.
Districts Have the Discretion to Create New Administrator Positions, but They Have Provided Inconsistent Justifications for Doing So
Districts have the discretion to create new administrator positions. State law requires each community college district to fix and prescribe the duties to be performed by those working in community college service in the district. However, we identified no state law requiring the districts to consider the impact on students’ academic success when creating new administrator positions. Nevertheless, the Audit Committee asked us to assess whether districts’ justifications for creating new administrator positions demonstrate that the new positions would contribute to improved academic success or address an increased workload. To do so, we reviewed districts’ documentation, such as Position Requisition forms, or other sources detailing the justifications for a selection of recently created administrator positions at the 10 districts we reviewed. Our review included the eight districts that had an increase in administrator positions, as Table 5 shows. However, one district—Los Rios—was not able to provide us with the documentation justifying new positions because the process it uses to approve new positions often takes place within committees that are not always required to maintain formal records. Los Rios officials further explained that in some cases, the administrator who created the position was no longer with the district, making it difficult to retrieve any related documentation.
Although we did not identify a law requiring them to do so, we found that the districts we reviewed did not consider the effect on student success when creating new administrator positions. Some districts’ justifications generally mentioned student success, but they did not specifically mention how the positions would improve student success metrics, which are tied to state funding. As one example of such a justification, we display in the text box San Diego’s materials supporting the creation of a new vice chancellor position within a larger reorganization, such as by changing the responsibilities of departments. This justification does not directly tie the added position to student success metrics used in state funding.
Excerpt From a Document Justifying the Addition of a Vice Chancellor Position
“The San Diego Community College District’s strategic planning process has established a vision for ensuring the success of all students and expanding diversity, equity, inclusion, accessibility, and anti-racism in all aspects of district operations. To achieve the vision, the strategic plan includes goals and objectives to address student success, academic excellence, workforce development, financial health, facilities, and resiliency. Achieving the goals is essential for the District’s ongoing operational integrity, ability to expand programs and services to students, attract and retain a highly skilled and qualified workforce, and invest in the infrastructure necessary to sustain an increasingly dynamic array of instructional programs and student supports.”
Source: San Diego board agenda item documentation.
Our review of districts’ forms for creating positions found that many districts’ justifications referenced workload. However, some districts’ justifications did not always make a direct connection to workload needs. For example, San Mateo’s documentation for adding a dean of enrollment services and support programs simply listed the description of the position’s responsibilities as justification for creating the position: the dean would serve as a technical advisor to review and resolve matters of regulatory interpretation related to the enrollment services, financial aid, and broader student services compliance areas of the college. Although the justification for this dean position did not directly identify an increased workload, San Mateo’s justification for reinstating a different position—the director of auxiliary services—did cite increased workload. San Mateo’s justification for that position mentions that the district assessed the responsibilities and reporting structure of the position and reinstated the position to meet existing district needs.
In another example, we reviewed documentation indicating that El Camino created an associate dean of library and learning resources because the responsibilities of the division had expanded substantially in areas of Dual Enrollment, non‑credit, and Guided Pathways, and the division needed more administrative support. Redwoods created a manager of Native American student success and support, which it stated is a required position to manage a specific grant. The justification detailed only what program the position would oversee. Further, Mt. San Antonio added a director of distance learning and instructional technology to strengthen efforts to increase enrollment, retention, and student success across racial and ethnic groups in online classes. The justification documentation included adding a new administrative specialist position to support the new director at a total salary and benefits of $97,000. However, in the absence of direction in the accounting manual, we did not expect to find, nor did we find, consistent information from the districts tracking the increased costs for administrative support for newly created administrator positions, as the audit objectives requested that we review.
Because of inconsistencies in the justifications we reviewed and the growth in the number of administrators—and to promote transparency for oversight boards and members of the public—districts could benefit from more consistently ensuring that they thoroughly justify the need for creating administrator positions. Although districts have discretion to create new positions, the Legislature could consider requiring districts to consistently and thoroughly document their justifications when creating new administrator positions by including whether the position is needed for increased workload or, if applicable, how the position will contribute to student success. If the district creates the position to improve student success, the district should identify the student success metrics by which it will measure that success.
Regardless of Staffing Changes, Student Success Metrics Have Improved
In addition to statewide increases in FTEs and salaries for administrator, faculty, and support staff, student success outcomes appear to have increased statewide during the last five fiscal years. The Student Centered Funding Formula (SCFF) provides funding to community college districts, in part, according to student success metrics. The Chancellors’ Office uses the student success metrics listed in the text box when determining the SCFF. State law assigns a point value to each of the student success metrics as part of the funding formula for the districts. For example, districts receive four points for each associate degree for transfer it grants and three points for each bachelor’s degree granted, determined by a three‑year rolling average. State law also requires the Chancellor’s Office to publish on its website the data it uses to determine the student success portion of funding allocations. We used the data and weighted metrics the Chancellor’s Office published to determine how student success has changed from fiscal years 2018–19 through 2023–24. Although we did not determine the causes of changes in student success outcomes, the data indicate that student success outcomes have improved during those years. For example, from fiscal years 2018–19 through 2023–24, associate degrees for transfer have increased by 10 percent and students completing transfer level math and English courses have increased by 33 percent, while the student population has dropped by about 7 percent. Many factors could contribute to the changes in student success outcomes, such as changes in state law and the effects of the pandemic. We did not perform data validation or assess the reliability of the data the Chancellor’s Office published. Because of these factors, causal relationships cannot be drawn between student success outcomes data and the other data we present in our report.
Student Success Metrics Include the Number of Students Who Receive:
- Associate Degree for Transfer
- Associate Degree
- Bachelor’s Degree
- Credit Certificate
- Completion of Transfer Level Mathematic and English
- Successful Transfer to a Four-Year University
- Nine or More Career Technical Education Units
- Attainment of Regional Living Wage
Source: State law.
Due to the concerns with the amounts spent outside the classroom, and the Legislature’s request that we report on increases in administrator positions and spending, we conclude that the Legislature could more thoroughly assess district spending on administrator staffing by requiring districts to report to it information on newly created administrator positions and the reasons for those additions. Reporting in this way will also position districts to better respond to questions from other stakeholders about the creation of new administrator positions.
Recommendations
Legislature
To help districts provide support services for students while continuing to comply with the 50 Percent Law, the Legislature should consider amending the 50 Percent Law to include, but not be limited to, either or both of the following as Instructor Salaries:
- The salaries and benefits of librarians.
- The salaries and benefits of counselors.
To offset the potential impact of including such expenses as Instructor Salaries, or the numerator of the calculation formula, the Legislature could also consider increasing the percentage at which districts must achieve compliance.
To ensure that the 50 Percent Law accounts for the changes in technology since its passage, the Legislature should consider amending the 50 Percent Law to allow districts to exclude technology expenses directly related to instruction from the 50 percent calculation.
To ensure that the Legislature has consistent information about basic needs services spending, and to allow the Legislature to determine whether it should similarly add additional basic needs services spending to Instructor Salaries, or the numerator of the calculation formula, after the Chancellor’s Office implements our recommendation to require consistent reporting of basic needs services, the Legislature should require that the Chancellor’s Office provide to it information on basic needs services spending by restricted and unrestricted funding for each district.
To ensure that districts spend lottery funds consistent with the law, the Legislature should consider defining or clarifying the noninstructional purposes for which lottery funds may not be spent.
To ensure that community‑supported districts comply with the 50 Percent Law, the Legislature should consider creating an enforcement mechanism that effectively applies to community‑supported districts. For example, the Legislature could consider imposing a financial penalty, such as a fine.
To promote transparency and to ensure that stakeholders have appropriate information about the rationale for creating new administrator positions, the Legislature could consider requiring districts to do the following:
- Consistently and thoroughly document their justifications when creating new administrator positions by including whether the position is needed for increased workload, or if applicable, how the position will contribute to student success. If a district creates the position to improve student success, the district should identify the student success metrics by which it will measure the position’s success.
- Report annually to the Legislature information on newly created administrator positions, the justification for those additional positions, and the funding source used to pay for the position.
Chancellor’s Office
To ensure that districts consistently track their spending on basic needs services, the Chancellor’s Office should update its accounting manual by September 2025 to include an accounting code for basic needs services and specify which basic needs services districts must include under this code.
To ensure that districts submit accurate information related to their compliance with the 50 Percent Law, the Chancellor’s Office should do the following by September 2025:
- Provide the districts with regular training and clarify its existing guidance. The trainings should include instruction about how districts should correctly classify instructional aides and should identify the correct accounting codes districts should use to accurately identify transactions included in Instructor Salaries, Current Educational Expenses, and exclusions.
- Provide training and clarify its guidance to districts that only ISAs in the “Other Expenditures” category should be included as Instructor Salaries.
- Provide districts with guidance about what constitutes an instructional and noninstructional purpose when expending lottery funds.
- Perform basic reviews of the financial reports that the districts submit to identify any obvious errors in reporting, such as the numerator of a section being larger than the denominator.
To ensure that districts follow the exemption process when they have not complied with the 50 Percent Law, the Chancellors Office should create a policy by September 2025 for verifying that a district’s compliance plan specifies how the district will spend the deficient amount for Instructor Salaries during the next fiscal year and ensuring that the district governing board has certified the compliance plans.
To ensure that Calbright complies with state law, the Chancellor’s Office should immediately require Calbright to follow the process to apply for an exemption as state law prescribes, including submitting the initial exemption application and second exemption form, and obtaining a decision from the CCC Board of Governors.
To ensure that the Chancellor’s Office and other stakeholders have accurate data about administrator, faculty, and support service staffing and salary information, the Chancellor’s Office should do the following by September 2025:
- Perform basic checks of its administrator, faculty, and support service staffing and salary data by checking district submissions for fewer than one FTE or less than one dollar for salaries in the administrator, faculty, and support staff categories. The Chancellor’s Office should follow up with districts about any potential errors it identifies.
- Implement a training and guidance program for districts about their submission of required staffing and salary data for administrator, faculty, and support staff, and require all districts to complete it.
We conducted this performance audit in accordance with generally accepted government auditing standards and under the authority vested in the California State Auditor by Government Code section 8543 et seq. Those standards require that we plan and perform the audit to obtain sufficient, appropriate evidence to provide a reasonable basis for our findings and conclusions based on the audit objectives. We believe that the evidence obtained provides a reasonable basis for our findings and conclusions based on our audit objectives.
Respectfully submitted,
GRANT PARKS
California State Auditor
April 8, 2025
Staff:
Michelle Sanders, PMP, Audit Principal
Christopher P. Bellows, Senior Auditor
Delise M. Coleman
Robert J Evans
Valerie Gibbons
Rachel Hibbard, JD, CGFM
Vlada Lipkind
Tammy Lozano, CPA, Retired Annuitant
Rebecca McNeil, MA
Kate Monahan
Eduardo Moncada
Joel Szakmeister
Legal Counsel:
David King
Appendices
Appendix A
Appendix B
Appendix C
Appendix A
Statewide FTE Ratios by Type of Employee, Fiscal Years 2012–13 Through 2023–24
State law requires implementation of a comprehensive community college educational and fiscal accountability system. Such a system is intended to help identify the educational and fiscal strengths and weaknesses of the State’s community colleges and to improve the quality of education, and is dependent, in part, on an adequate data collection and reporting system. In order for the districts to receive specified funds in the annual Budget Act, the district must provide certain data to the Chancellor’s Office. The Chancellor’s Office collects and maintains this data through MIS. We provide information from MIS in Table A. However, we question the reliability of this data. Nevertheless, because this data is the most readily available aggregate data for 73 districts, we present that information below.
Appendix B
Districts’ Self‑Reported Compliance With the 50 Percent Law, Fiscal Years 2018–19 Through 2022–23
California law requires districts to annually self‑report their percentage of costs in Instructor Salaries compared to their overall expenditures in the Current Educational Expenses. The 50 Percent Law requires this number to be at least 50 percent in each fiscal year. Table B lists each of the CCC districts’ self‑reported compliance with the 50 Percent Law from fiscal years 2018–19 through 2022–23.
Appendix C
Districts’ Self‑Reported FTEs and Total Salaries, Fiscal Years 2012–13 Through 2022–23
State law requires implementation of a comprehensive community college educational and fiscal accountability system. Such a system is intended to help identify the educational and fiscal strengths and weaknesses of the State’s community colleges and to improve the quality of education, and is dependent, in part, on an adequate data collection and reporting system. In order for the districts to receive specified funds in the annual Budget Act, the district must provide data to the Chancellor’s Office. The Chancellor’s Office collects and maintains this data through MIS. In Tables C.1, C.2, C.3, C.4, C.5, and C.6, we provide information from MIS on FTEs and total salaries by district. However, as discussed in our report, we question the reliability of this data. Nevertheless, because this data is the most readily available aggregate data for 73 districts, we present that information in Table C.1. Further, in this section of the report and in this section of the Figure 9, we provide data for fiscal years 2013–14 through 2023–24 because it is the most recently available information. In these tables, we provide data from fiscal years 2012–13 through 2022–23 because the audit objectives specifically request those years. Therefore, there will be a difference between what is reported in some tables in the report compared to what is reported in these Appendix tables.
Appendix D
Scope and Methodology
The Audit Committee directed our office to conduct an audit of the CCC compliance with the 50 Percent Law and administrative expenditures. Table D lists the objectives that the Audit Committee approved and the methods we used to address them. Unless otherwise stated in the table or elsewhere in the report, statements and conclusions about items selected for review should not be projected to the population.
Assessment of Data Reliability
The U.S. Government Accountability Office, whose standards we are statutorily obligated to follow, requires us to assess the sufficiency and appropriateness of computer‑processed information we use to support our findings, conclusions, or recommendations. In performing this audit we relied on the Chancellor’s Office 50 Percent Law compliance reports and the financial reports submitted by each district we reviewed from fiscal years 2018–19 through 2022–23. We used the data in the Chancellor’s Office compliance reports to display district‑reported compliance rates. We used the data in the financial reports submitted by each district we reviewed to verify the Chancellor’s Office compliance reports and to recalculate districts’ compliance with the 50 Percent Law based on errors we identified in their reporting. To evaluate the available data, we reviewed existing information about the data and performed testing of the data. Specifically, we cross‑referenced the Chancellor’s Office compliance reports with the financial reports and audited financial reports of the 10 districts we reviewed. In addition, we cross‑referenced the financial reports submitted by the districts we reviewed with each district’s audited financial reports. Based on our analysis, we found the data in these reports to be sufficiently reliable for our purposes.
We also obtained Chancellor’s Office data regarding FTE staffing numbers, salaries, and FTE students (FTES). We used these data to report on the trends in FTE staffing numbers, salaries, and ratios for districts from fiscal years 2012–13 through 2023–24. To evaluate the available data, we interviewed staff knowledgeable about the data and performed testing of the data. When we cross‑referenced the FTE and salary data that we received from the Chancellor’s Office with the districts’ own internal data, we found some inconsistencies in the data. For example, some districts did not report their data, were unable to retrieve their data for some of the years we reviewed, or reported data inconsistent with the size of their districts or previous years’ submissions. Because of these inconsistencies, we found the data to be of undetermined reliability for our purposes. Although we recognize that these limitations may affect the precision of the numbers we present, there is sufficient evidence in total to support our audit findings, conclusions, and recommendations. For FTES data, we cross‑referenced the FTES data we received from the Chancellor’s Office with the districts’ audited financial reports. However, the districts’ audited financial reports only include resident FTES and we could not cross‑reference non‑resident FTES. Nonetheless, we found this data to be reliable for our purposes.
In performing this audit, we obtained available data regarding basic needs and support services from the ten districts we reviewed. We used these data to determine the impact these services have on districts’ compliance with the 50 Percent Law. We did not assess the reliability of these data because doing so was cost‑prohibitive. As a result, these data are of undetermined reliability. As we discuss earlier in the report, we identified other issues in the basic needs services data that contributed to our determination. Even though this determination may affect the precision of the numbers we present, there is sufficient evidence in total to support our audit findings, conclusions, and recommendations.
Agency Responses
California Community Colleges
San Mateo County Community College District
California Community Colleges
March 17, 2024
VIA U.S. MAIL & EMAIL
Grant Parks, California State Auditor
621 Capitol Mall, Suite 1200
Sacramento, CA 95814
Re: Response to 50 Percent Law Audit
Dear Mr. Parks:
The Chancellor’s Office has reviewed the draft audit report on the 50 Percent Law. We were pleased to learn that most districts that were audited had complied with the Law.
Consistent with the audit report, the Chancellor’s Office has observed that the delivery of classroom instruction has evolved significantly since the 50 Percent Law was enacted more than 60 years ago. We look forward to working with our districts, students, faculty, and other stakeholders to bring new, more efficient technologies to student learning and the future calculation of the 50 Percent Law.
The Chancellor’s Office will work to implement the recommendations in the audit report. Our team is small, and we appreciate your highlighting areas that may affect future calculations under the 50 Percent Law, such as the use of unrestricted funds for basic needs services for our students. As you recommend, we will update our accounting manual to better assist districts in tracking these services.
We also fully understand the need for additional oversight, guidance, and training, and we will repurpose our limited resources to continue to partner with districts to help them comply with the 50 Percent Law.
On behalf of the Chancellor’s Office, I extend my appreciation to the audit team for their hard work and collaboration throughout the audit process.
Sincerely,
Chris Ferguson,
Executive Vice Chancellor,
Finance & Strategic Initiatives
San Mateo County Community College District
March 11, 2025
Mr. Grant Parks
California State Auditor
621 Capitol Mall, Ste. 1200
Sacramento, CA 95814
Re: San Mateo County Community College District – Response to Draft 50% Law Audit Report
Dear Mr. Parks:
The San Mateo County Community College District (SMCCCD) provides this response to the Draft 50% Law Audit Report.
① I. The Statement that “San Mateo Inaccurately Reports their Compliance Rates” is False (p.6 and p.35).
The report falsely indicates that SMCCCD inaccurately reported its compliance rates (p.6 and p.35). As staff shared during the audit process with documented proof, in FY 2018-19, the district miscoded an offset to an expense in unrestricted general fund accounts (object codes 18xx and 13xx.) This internal coding did not impact in any way our 50% Law calculation because compliance is calculated based upon the sum of all relevant object codes in the unrestricted general fund. As such, the 50% Law calculation was correctly reported. This was transparently disclosed with documented proof and explained during the audit work. At that time, Staff requested that this conclusion be removed as not factual. In addition, the report implies that SMCCCD miscoded for more than just one year.
II. The Statement that “Districts Increased the Number of Administrators by 45%” (p.7 and p.62) Is False. The Statement that “Districts’ Investment in Administrators Seems to Have Generally Outpaced That for Faculty and Support Staff” is Also False As It Relates to SMCCCD.
② a. The Grossly Inflated and Misleading Statements are Based on Inaccurate MIS Data. SMCCCD’s Accurate Payroll Data from the Same Time Period Correctly Shows a Modest 7.8% Increase in Administrators, Reflecting a Near 6X Error by the State.
The Draft Report misrepresents the changes to administrative staffing levels based on flawed MIS data that was used as its basis for the report’s conclusion with respect to SMCCCD. The inaccurate MIS data included positions from restricted funds and had many errors. On page 6 of the Draft report, the State acknowledges that “Restricted funds are excluded from the 50 percent formula…”. Reliance on the flawed MIS data caused an inflated number (6X) thus grossly misrepresenting the increase of Administrative Staff at SMCCCD. As the report acknowledges, SMCCCD staff provided accurate payroll data which indicates a 7.8% increase in Administrative Staffing over the referenced time period for the unrestricted general fund (which is the purview of the 50% Law). To be clear, Administrators at SMCCCD only increased by 7.8% which does not support the conclusion that SMCCCD has significantly outpaced the growth Faculty (3%) and Support Staff (7%). Staff painstakingly worked with the auditors to show the inaccuracies in the MIS data line-by-line and provided spreadsheets pointing to each error in the MIS report and simultaneously compared it to the accurate payroll reporting of the District. The MIS data inaccurately included all iterations of administrative positions in single years (such as temporary interim assignments prior to permanent appointments). For example, the MIS report showed that Skyline College had three full-time Presidents in a single year, which is utterly preposterous. In addition, the SMCCCD data also showed that five Vice Chancellor positions were removed and were never replaced during the same time period, and to date, SMCCCD only has two Vice Chancellors. It was explained that this was an effort by the Board of Trustees to trim Executive excess in furtherance of the 50% Law. ③ Despite the incredibly detailed work of SMCCCD staff to prove the errors and show a significant effort on the part of the District to decrease executives, the inaccurate MIS data was nonetheless used by the auditor to reach its unfounded conclusions about SMCCCD. In addition, in footnote 6 on p.62, the State’s statement regarding its inability to verify the reliability of SMCCCD’s payroll data is false. No such request was made to verify the payroll register data.
④ III. The Statement that it is “Unclear Whether the 50% Law is as Effective in Improving Student Outcomes as Originally Intended (p.5) is False. The 50% Law, Has Been Widely Criticized as Antiquated with Compelling Data that it is No Longer Effective in Improving Student Outcomes. Therefore, the State Should Reflect this in its Findings that it is Crystal Clear.
How could the 50% Law still be effective when it was created during an era of Black & White TV and antennas that didn’t work? It’s a flawed premise. As educators, to prepare students to be successful in the “Computer Age,” and to compete in a global economy, we must provide opportunities for students to excel and ensure they are able to meet the challenges of today, not 1961! The State’s own audit published 9/24/24 (titled in part: Streamlining the Community College Transfer Process…) recognizes that the 50% Law is not enough to improve student outcomes. In fact, it recommends increasing student support services and counseling to increase student success, in direct conflict with the 50% Law.
SMCCCD has had a long history of recognizing that investments are needed in areas outside of instruction, alongside our Statewide colleagues, which include student support services, increased counseling, increased technology support, and innovative initiatives designed to remove barriers faced by students. For example, SMCCCD’s Free College Initiative (SB 893) increased SMCCCD’s enrollments by an unprecedented 24% over the last two years, and the data shows that we are reaching more first-time, first-generation students than ever before. SMCCCD’s has proven that enrollment fees, no matter how small, are a big barrier to students enrolling in college.
In addition, other investments by SMCCCD are costly, in a modern world driven by technology, such as prevention of exorbitant financial aid fraud, ensuring student access to computers and the internet, and an ever-growing IT department implementing automation and fighting cyber-crime – all of which were never contemplated by an antiquated 50% Law.
⑤ As Chancellor of this District, I stand tall in our commitment to our students. While we are committed to continuing our work on compliance, I want it known that our District’s lack of compliance is most certainly not because of inflated administrative staffing as is stated by this report. Instead, it appears to be caused by our efforts to align with long-standing initiatives of the California Community Colleges Chancellor’s Office to remove barriers, improve technology and innovation, and support student success. We hope the State chooses to support our students in the many ways that have proven effective in getting students to degree completion and into the workforce and avoid action that would be antithetical to our collective mission: Students First.
Sincerely,
Melisa Moreno, J.D., Chancellor
San Mateo County Community College District
Comments
CALIFORNIA STATE AUDITOR’S COMMENTS ON THE RESPONSE FROM THE SAN MATEO COUNTY COMMUNITY COLLEGE DISTRICT
To provide clarity and perspective, we are commenting on the response to our audit report from San Mateo. The numbers below correspond with the numbers we have placed in the margin of San Mateo’s response.
① While preparing our draft report for publication, some page numbers shifted. Therefore, the page numbers that San Mateo cites in its response do not correspond to the final report. San Mateo’s assertion that our report contains false information is inaccurate. As we note in Figure 5, and as we further describe here, San Mateo incorrectly reported a larger amount in certain categories for Instructor Salaries, or the numerator of the 50 percent calculation, than it did in the Current Educational Expenses, or the denominator of the 50 percent calculation. A fiscal specialist at the Chancellor’s Office indicated that this is not the proper way to report those transactions. As we describe, districts must report all transactions they include in Instructor Salaries in Current Educational Expenses as well. San Mateo’s error led to incorrect reporting, although we acknowledge in the report that this error was minor and did not affect the district’s compliance with the 50 Percent Law.
② San Mateo’s concerns regarding the flawed MIS data are similar to those that we raise in our report. As we disclose, in our review of the Chancellor’s Office’s statewide FTE staffing and salary data and our review of data from the 10 districts, we identified anomalies and discrepancies that made us question its accuracy and reliability. However, as we note, because it is the most readily available source of the aggregate data across the 73 districts, we present it in our report. Further, we disclose that the statewide data we present includes administrator positions funded with both restricted funds and unrestricted funds. Because the administrator staffing percentages that San Mateo cites in its response does not include positions paid for from restricted funds, it is not comparable to the data we present in our report. Further, the staffing percentages that San Mateo cites in its response corroborate the conclusion in our report that administrator FTEs have outpaced those of faculty and support staff.
③ The MIS data that San Mateo disputes in its response is based on data that it self-reported to the Chancellor’s Office and that we found matched the Chancellor’s Office’s data—therefore, San Mateo is taking issue with the accuracy of its own reported data. Nevertheless, we describe San Mateo’s concerns with the data in our report here and in Table 5 and include information that it provided to us from its payroll system. Because we include San Mateo’s information in our report to further corroborate our concerns about the reliability of the statewide MIS data, we did not find it necessary to perform an assessment of reliability of that data. However, audit standards require that we disclose whether we performed an assessment of reliability of that data and therefore include that disclosure in our report.
④ We agree with San Mateo’s assertions that the 50 Percent Law could be updated to reflect the needs of students today. In fact, our report makes this argument in the section that begins here. For example, we explain that there have been significant changes to the delivery of education and student needs since the passage of the 50 Percent Law in 1961. Indeed, we recommend that the Legislature consider revising the 50 Percent Law to include the salaries and benefits of counselors and librarians as Instructor Salaries, and to exclude technology costs from the 50 percent calculation.
⑤ San Mateo incorrectly implies that our report attributes San Mateo’s noncompliance to the district’s inflated administrative staffing. Nowhere in our report do we state that San Mateo’s compliance rate of nearly 10 percentage points less than the 50 percent required in law is due to administrative staffing, either explicitly or implicitly.
- Basic needs services can include food, housing, clothing, childcare, and mental health support. ↩︎
- The totals for support services in Table 2 include all expenditures, not just salaries and benefits. The information provided by the districts did not allow us to consistently isolate the salaries for support services. As a result, these totals capture more than just the expenses for library and counseling support services that could be included in the potential compliance rate. ↩︎
- For most districts, we selected transactions from fiscal years 2018–19 through 2022–23. For some districts, where information was available, we also selected from fiscal year 2023–24. ↩︎
- ACBO is a nonprofit entity independent of the Chancellor’s Office. Its primary purpose is to provide statewide leadership on CCC business and financial matters and issues. ↩︎
- State law requires the CCC Board of Governors to grant an exemption for any deficient amount that is less than one thousand dollars. ↩︎
- The data we reviewed contained more than 2,600 data points for the FTE data and more than 5,200 data points for the salary data. ↩︎
- We did not perform an assessment of the reliability of the district’s payroll data. ↩︎
- Dual Enrollment allows students to take community college classes while still in high school, and Guided Pathways is a framework to advance equity and to holistically support students’ academic and non‑academic needs. ↩︎
